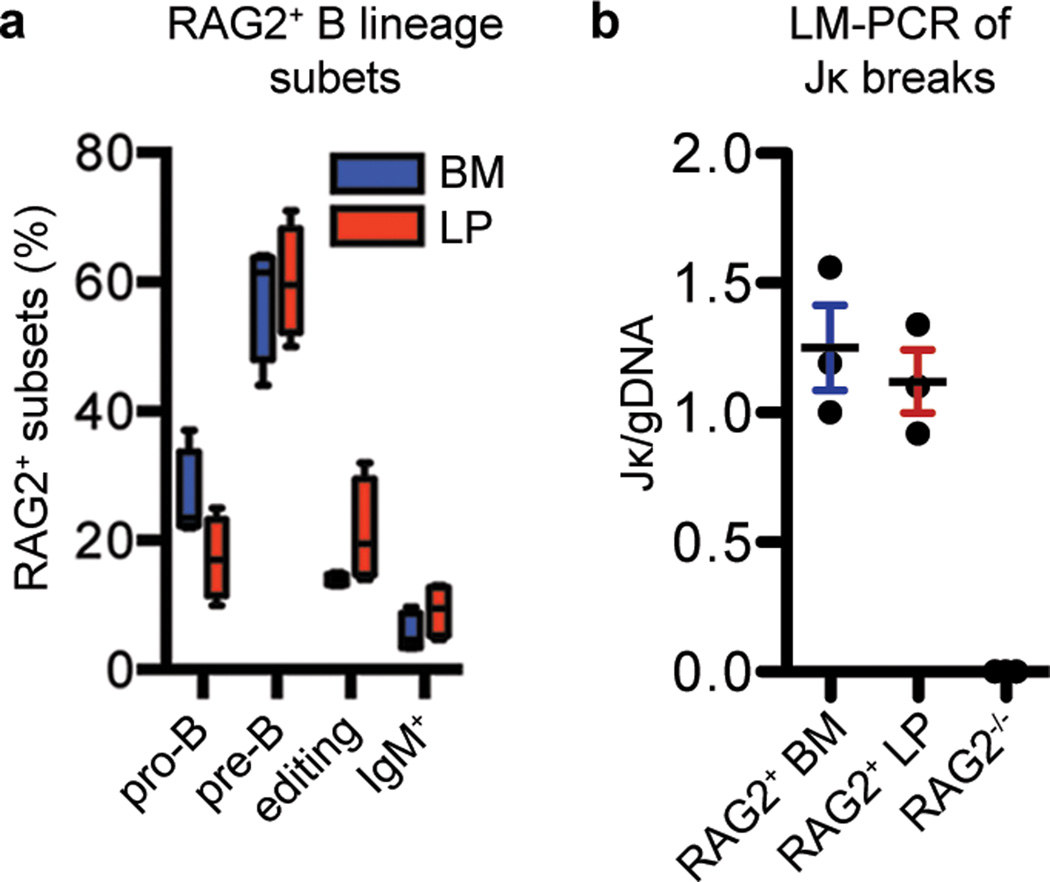
Figure 2. RAG2-GFP+ LP B lineage developmental subsets.
a, Plots show the relative percentage Rag2-expressing pro-B cells, pre-B cells, editing B cells and surface IgM+ B cells (see text for definition of each) in the bone marrow (blue bars) and lamina propria (red bars). Plotted are mean values ± s.e.m. and each are derived from experiments of 4 independent mice at post-natal day 17–24 (see Supplementary Fig. 7 for more details). b, Plots show quantitative ligation-mediated PCR of RAG2+ BM B cells and RAG2+ LP B cells normalized to genomic DNA. BM cells from RAG2−/− mice were a negative control. Values on the y-axis are units relative to the signal obtained from a RAG2+ BM B cell samples.

