
Figure 3. Distinct Vκ segment usage in RAG2+ cells from BM versus LP.
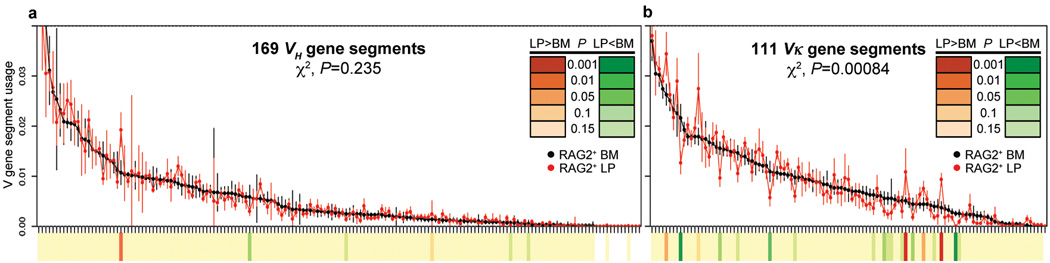
a,b, Dot plots show contributions (in order of highest to lowest BM utilization) of different VHs (a) and Vκs (b) to in-frame rearrangements in RAG2-GFP+ BM (black dots) and LP (red dots) cells. The two most highly utilized VHs are omitted to increase plot resolution. Each point shows mean ± s.e.m. of at least 4 experiments. The χ2 calculated P values for overall differences between BM and LP are indicated. Significant V segment utilization differences between BM and LP are indicated on heat map (P values scale indicated in inset). Full data set at increased resolution is in Supplementary Fig. 12.