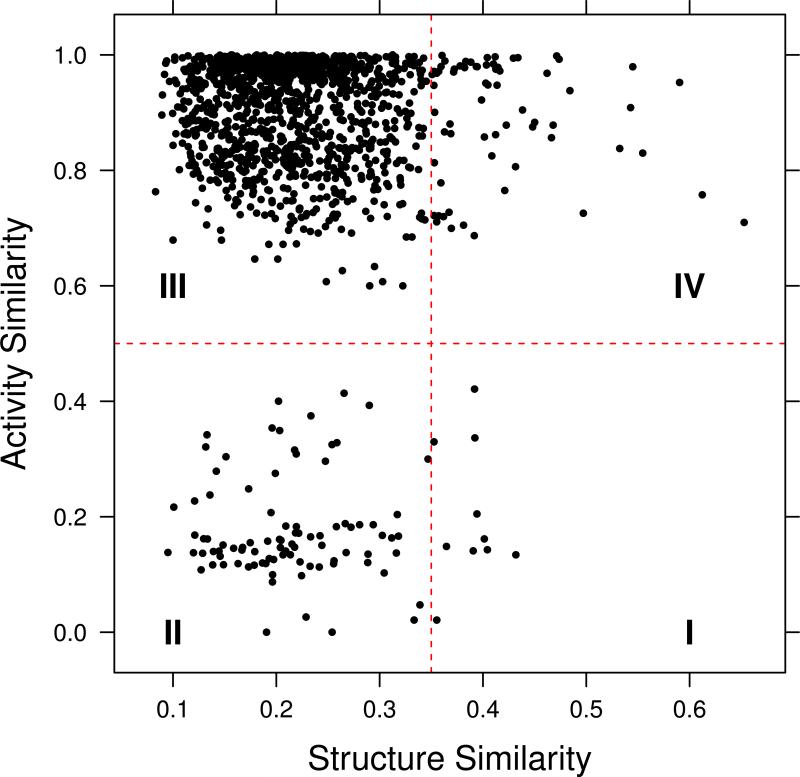
Figure 1.
An example of a Structure-Activity Similarity (SAS) map. Quadrants I, II, III and IV correspond to rough regions (activity cliffs), non-descript regions, scaffold hops and smooth regions of an activity landscape, respectively. The map was generated for a random subset of 50 compunds taken from the GSK malaria dataset [41]. Structure similarity was evaluated using CDK [42] hashed fingerprints and the Tanimoto metric.

