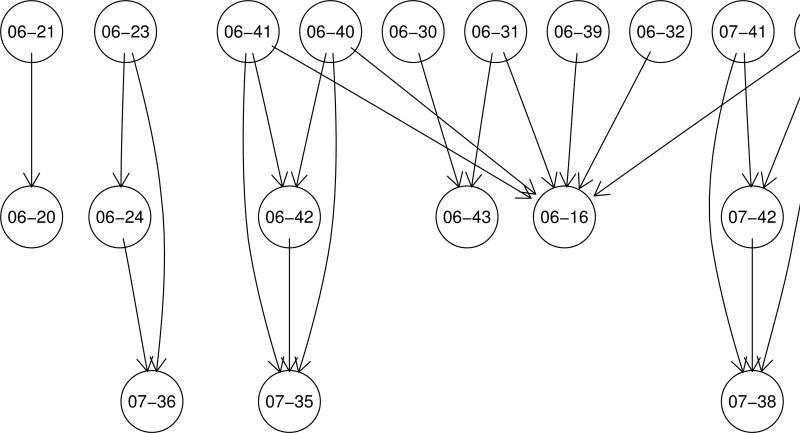
Figure 3.
A SALI network visualization for a set of 62 glucocorticoid inhibitors [3, 2], generated using a SALI threshold of 30% of the maximum SALI value for this dataset. Each node represents a compound and an edge is drawn if the SALI value for the pair of compounds was greater than the threshold.

