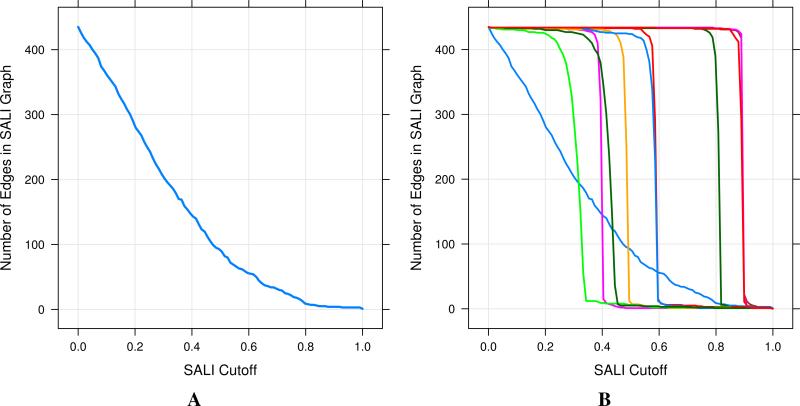
Figure 6.
Characterizing the smoothness of activity landscapes, by counting edges in the SALI network at varying SALI thresholds. A is derived from a binary fingerprint representation and appears to represent a “good” landscape. B represents curves from randomly selected 2D 4-descriptor representations. In general these representations lead to overly smooth or overly jagged landscapes. The light blue line represents the curve obtained from the fingerprint representation.

