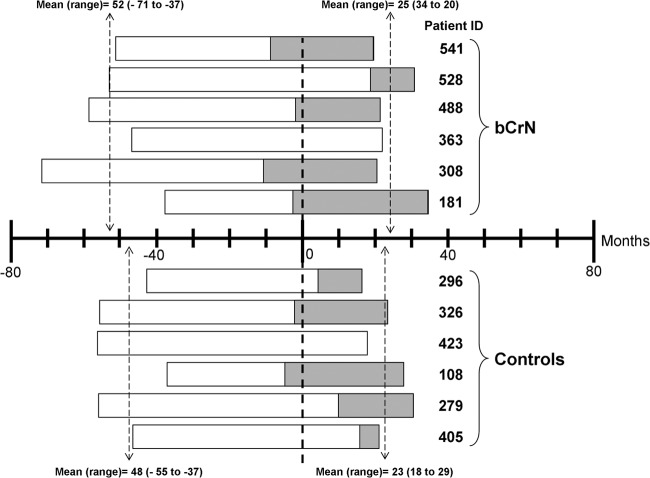
Fig 1.
Study chart. Time zero corresponds to the last time point analyzed in the previous study (15). The period included in the present study before and after the previous cross-sectional study (mean and range) is indicated. The periods in which some patients were on cART are also indicated.

