Fig 5.

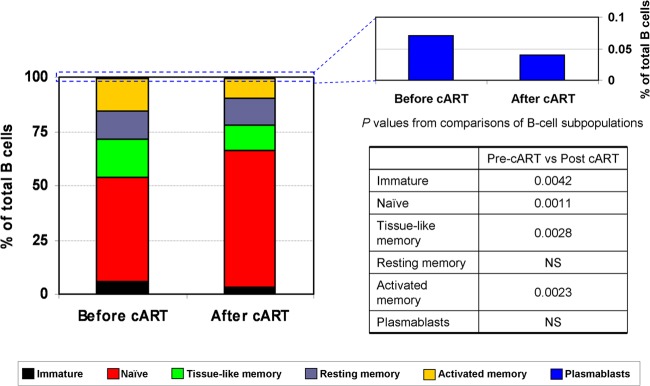
Distribution of B-cell subpopulations before and after cART. The percentages of cells in each of the six B-cell subpopulations for samples from patients before and after cART are shown. The mean frequencies for different B-cell subpopulations are denoted by different colors. P values from comparisons of B-cell subpopulations are also shown. NS, not significant.
