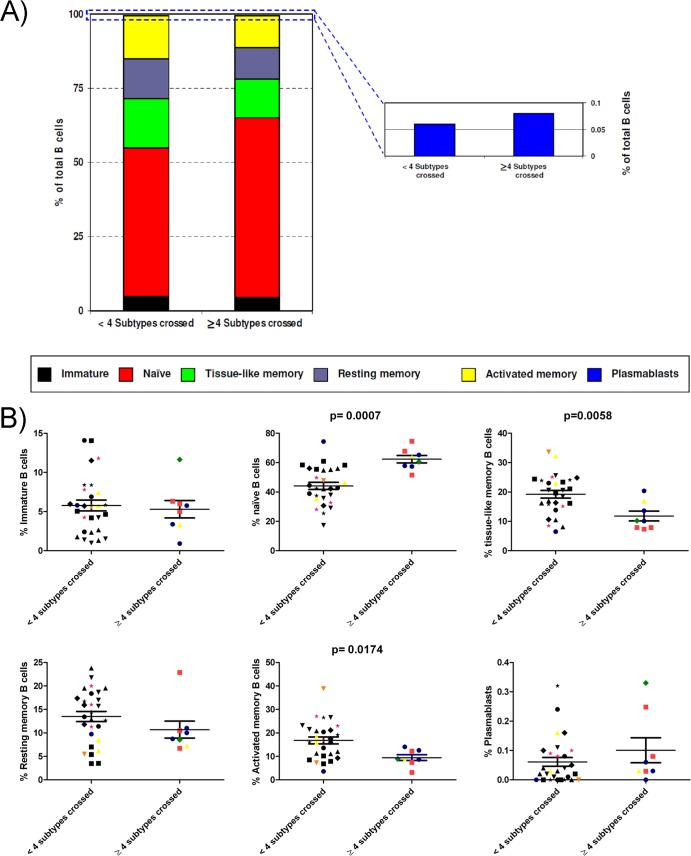
Fig 6.
Distribution of B-cell subpopulations in samples with different neutralization breadths. (A) The percentages of cells in each of the six B-cell subpopulations were measured for samples from patients capable of neutralizing viruses across 4 or more subtypes and patients that neutralized viruses from fewer than 4 subtypes. The mean frequencies for different B-cell subpopulations are denoted by different colors. (B) Statistical analysis of each B-cell subpopulation. Horizontal bars within the point plots indicate the median percentage for each group ± the SEM. Significance between groups is indicated above the groups. Each type of symbol corresponds to a different patient. Black symbols, control patients; green diamonds, patient 181; red squares, patient 308; blue circles, patient 363; pink stars, patient 488; yellow triangles, patient 528; and orange inverted triangles, patient 541. Mann-Whitney U tests were used for comparisons between groups. Simple comparisons were made with use of a two-sided alpha level of 0.05.

