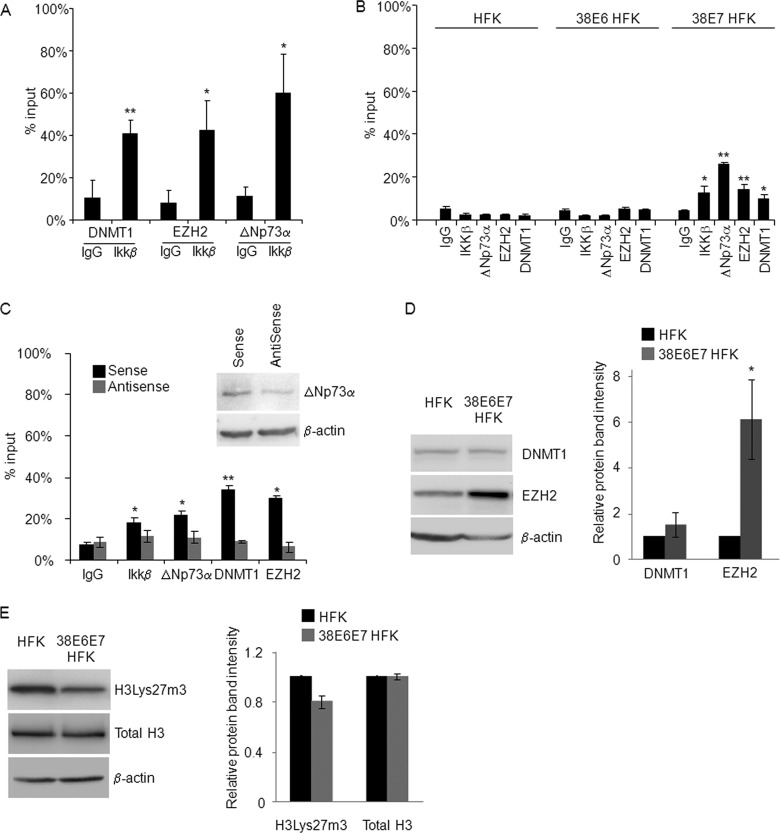
Fig 4.
Endogenous EZH2, DNMT1, IKKβ, and ΔNp73α cobind on the PIG3 promoter. (A) 38E6E7 HFK were harvested and formaldehyde fixed. After sonication, the chromatin was subjected to ChIP assay using DNMT1, EZH2, or ΔNp73α antibodies. The eluted DNA was processed for Re-ChIP with anti-IKKβ antibody or nonspecific IgG control. Input and coimmunoprecipitation DNA were analyzed by qPCR for the p53RE region of the PIG3 promoter. The results are the average of two independent experiments performed in duplicate. * and **, P < 0.05 and P < 0.01, respectively, versus the corresponding IgG control. (B) HFK, 38E6 HFK, and 38E7 HFK were subjected to ChIP assay using antibodies for the indicated proteins or nonspecific IgG control. Input and eluted DNA were analyzed by qPCR for the p53RE region of the PIG3 promoter. The results were generated as indicated for Fig. 2A and are the average of two independent experiments performed in duplicate. * and **, P < 0.05 and P < 0.01, respectively, versus the corresponding IgG control. (C) Sense and ΔNp73α-AntiSense oligonucleotides were transfected into 38E6E7 HFK. The cells were collected 36 h after transfection and used for ChIP assay with the indicated antibodies. The amounts of p53RE bound to the different proteins were calculated as described for Fig. 2A. The data shown are the mean values of two independent experiments. * and **, P < 0.05 and P < 0.01, respectively, versus the corresponding IgG control. The protein levels of ΔNp73a and β-actin were detected by IB (top right panel). Result is representative of two independent experiments. (D) Protein extracts (40 μg) from HFK and 38E6E7 HFK were analyzed by IB for protein levels of DNMT1, EZH2, and β-actin (left panel). Band intensities were quantified and normalized to β-actin levels (right panel). The data shown are the mean values of three independent experiments. *, P < 0.05 versus the corresponding HFK sample. (E) HFK and 38E6E7 HFK were lysed with RIPA buffer and sonicated as explained in Materials and Methods. The protein extracts (40 μg) were analyzed by IB for protein levels of histone H3Lys27m3, total histone H3, and β-actin (left panel). Band intensities were quantified as explained for Fig. 1C and normalized to β-actin levels (right panel). The data shown are the mean values of two independent experiments. The difference in the levels of histone H3Lys27m3 between 38E6E7 HFK and HFK is not statistically significant.

