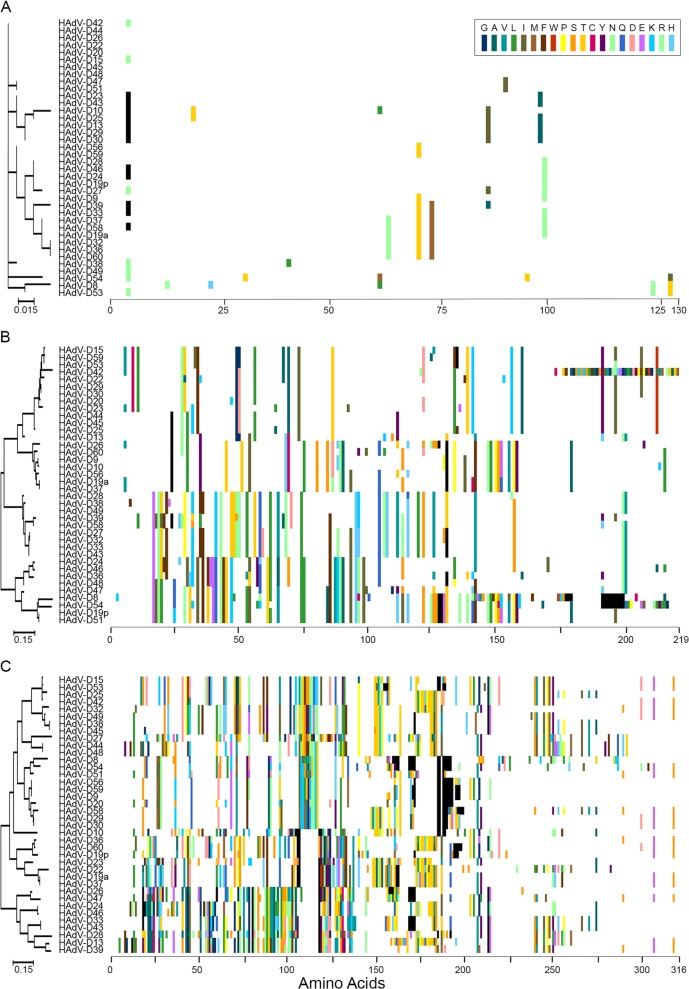
Fig 2.
Proteotyping analysis for select open reading frames of the E3 transcription unit of HAdV-D: (A) E3 14.7K; (B) CR1α; (C) CR1γ. Proteotyping analysis of CR1β was previously published (6). Maximum likelihood phylogenetic trees are shown to the left for each putative protein, and amino acid signatures are on the right. The scale bar at the bottom left of each panel denotes the phylogenetic distance reflected in the horizontal dimension of the corresponding tree. To construct the amino acid signatures shown, each amino acid was assigned a unique color (see the legend in the upper right corner), consensus amino acids at each position across all 38 viruses were assigned white, and gaps in the alignment are shown in black.

