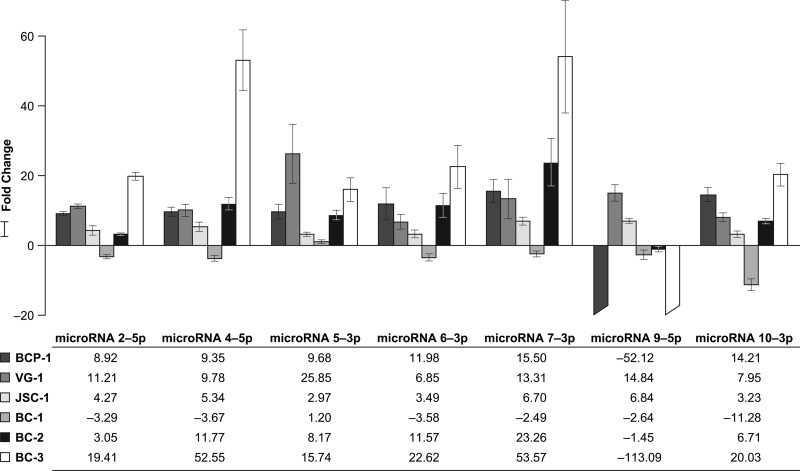
Fig 3.
Applied Biosystems custom small RNA RT-PCR analysis of KSHV latently infected PEL cell lines. Mature microRNA expression levels are shown as the fold change in expression of the target genes (microRNAs) normalized to the level of expression of the internal control gene (RNU6B) and relative to the level of expression by the wild-type BCBL-1 cell line using the 2-ΔΔCT method (23). A positive fold change represents an upregulated PEL cell line, whereas a negative fold change represents a downregulated PEL cell line. The negative fold changes presented here were obtained by taking the negative inverse (i.e., −1/fold change of the result from the 2−ΔΔCT method). Standard errors were computed in the R package plotrix. These values were then used to compute interval limits (95%) on the basis of 4 degrees of freedom (3 treated sample replicates + 3 control sample replicates − 2). Values were then transformed from log2 to fold change scale by exponentiation, 2x, where x denotes the lower limit and upper limit of the standard error values for each PEL cell line of interest compared, and appropriate standard error bars are added. The standard error bars are asymmetrical due to exponentiation.

