
Fig 5.
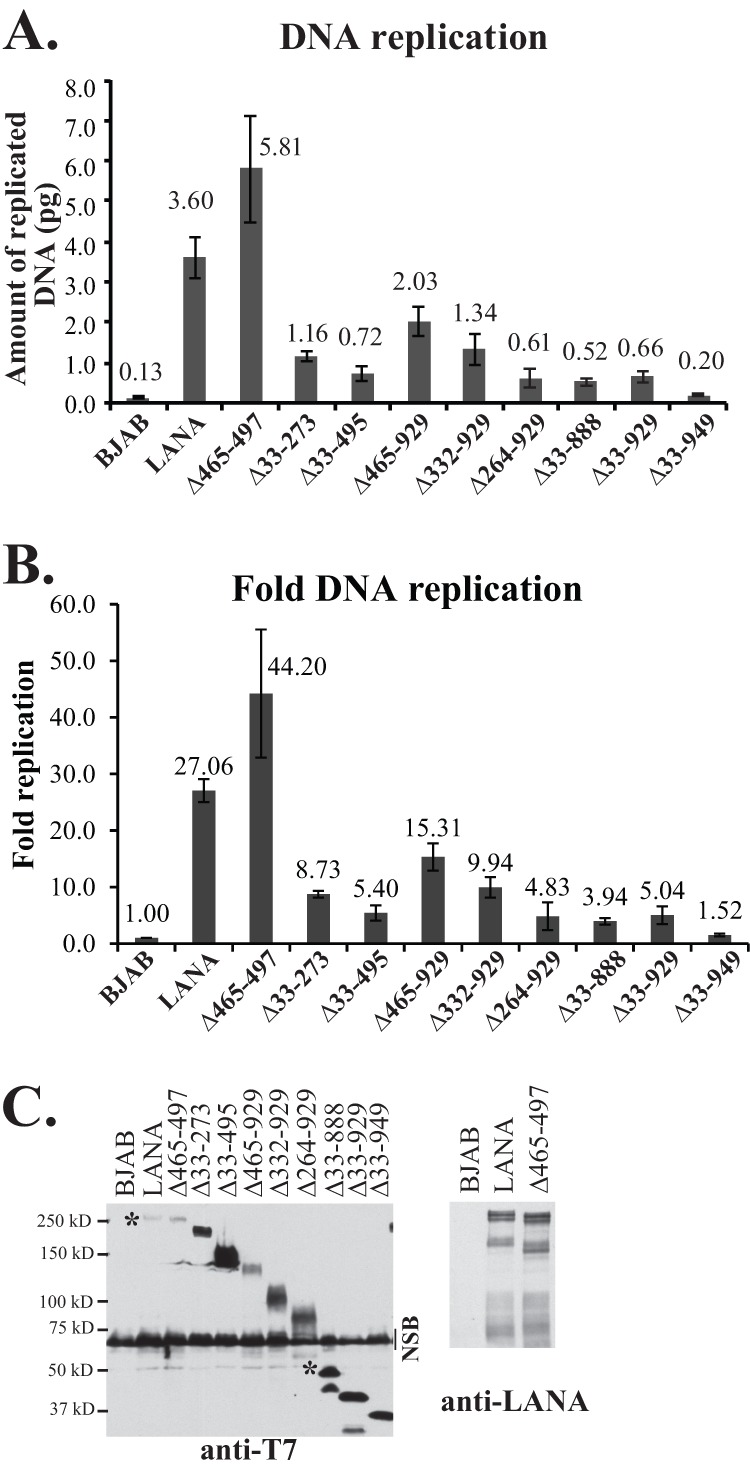
Deletion of internal LANA regions results in decreased DNA replication. (A and B) BJAB cells alone or BJAB cells stably expressing LANA or different LANA deletion mutants were transfected with p8TR-gB, which contains 8 copies of the TR. Hirt DNA was isolated at 24 h posttransfection for the assessment of transfection efficiencies and again at 72 h posttransfection for the assessment of replicated DNA. The amounts of p8TR-gB present in the Hirt DNA samples were quantified by real-time PCR. To normalize for transfection efficiencies, the amount of p8TR-gB detected in the samples at 24 h posttransfection was divided by the amount detected in BJAB control cells, and that result was termed the ratio of normalization. These values were close to 1. To normalize the amount of replicated p8TR-gB, the amount of replicated p8TR DNA detected at 72 h was divided by the corresponding ratio of normalization for each mutant. To calculate the fold p8TR-gB replication relative to the negative control (BJAB cells), the normalized replication of the samples was divided by the normalized replication detected for the BJAB control cells. The results represent averages for 4 experiments. (C) Western blotting of BJAB cells alone or BJAB cells expressing LANA or LANA mutants at the time of DNA replication. (Left) Anti-T7 epitope blot. Approximately 3.5 × 10⁵ cells were loaded per lane. NSB, nonspecific band. Asterisks indicate WT LANA and full-length LANAΔ33-888 bands. (Right) Anti-LANA blot of LANA and LANAΔ465-497. Approximately 1.5 × 10⁵ cells were loaded per lane. Brightness and contrast within each panel were uniformly adjusted with Adobe Photoshop. Deletions of the central repeat regions result in increased LANA expression (28, 39).