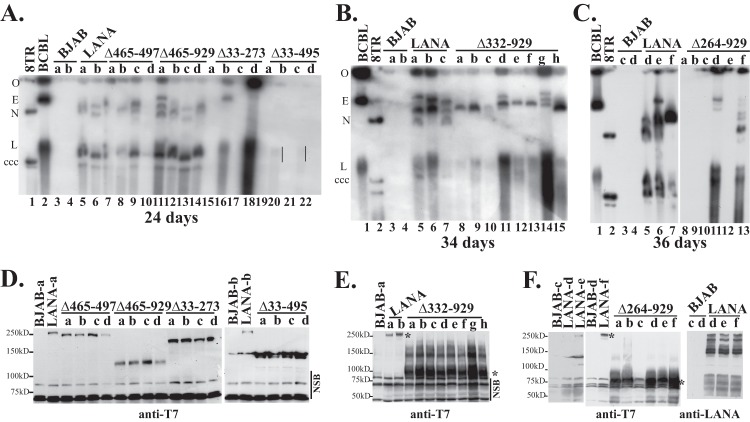
Fig 7.
LANA mutants have differing levels of episome maintenance deficiencies as assessed by Gardella gel analyses. BJAB cells alone, or BJAB cells stably expressing LANA or LANA deletion mutants, were transfected with p8TR. Seventy-two hours posttransfection, cells were seeded in 96-well plates and were selected for G418 resistance. Gardella cell analysis was performed to detect p8TR episomes from G418-resistant cell lines expanded from the microtiter plates. Approximately 1 × 10⁶ cells were loaded per lane in Gardella gels. (A) Gardella gel containing a naked p8TR plasmid (lane 1), BCBL-1 cells (a KSHV-infected primary effusion lymphoma cell line) (lane 2), p8TR-transfected, G418-resistant BJAB cells (lanes 3 and 4), or BJAB cells stably expressing LANA (lanes 5 and-6), LANAΔ465-497 (lanes 7 to 10), LANAΔ465-929 (lanes 11 to 14), LANAΔ33-273 (lanes 15 to 18), or LANAΔ33-495 (lanes 19 to 22). Vertical lines (lanes 20 and 22) indicate a faint episomal signal. The gel origin (O), BCBL-1 episomal (E) and linear (L) forms (linear due to lytic replication), and p8TR covalently closed circular (ccc) DNA and nicked (N) DNA are indicated. Gardella gel analysis was performed after 24 days of G418 selection. (B) Gardella gel with BCBL-1 cells (lane 1), naked p8TR plasmid (lane 2), p8TR-transfected, G418-resistant BJAB cells (lanes 3 and 4), or BJAB cells stably expressing LANA (lanes 5 to 7) or LANAΔ332-929 (lanes 8 to 15). Gardella gel analysis was performed after 34 days of G418 selection. (C) Gardella gel with BCBL-1 cells (lane 1), naked p8TR plasmid (lane 2), p8TR-transfected, G418-resistant BJAB cells (lanes 3 and 4), or BJAB cells stably expressing LANA (lanes 5 to 7) or LANAΔ264-929 (lanes 8 to 13). Gardella gel analysis was performed after 36 days of selection. (D to F) Immunoblot analyses for LANA or LANA mutants expressed in G418-resistant cell lines used in Gardella gel analyses. Panels D to F correspond to panels A to C, respectively. LANA was detected using an anti-T7 monoclonal antibody or an anti-LANA antibody. Approximately 3.5 × 10⁵ cells were loaded per lane for anti-T7 blots and ∼1.5 × 10⁵ cells per lane for the anti-LANA blot. Asterisks indicate LANAΔ332-929 or LANA bands. Brightness and contrast in individual panels were uniformly adjusted using Adobe Photoshop. Lowercase letters indicate individually selected G418-resistant cell lines. NSB, nonspecific bands.

