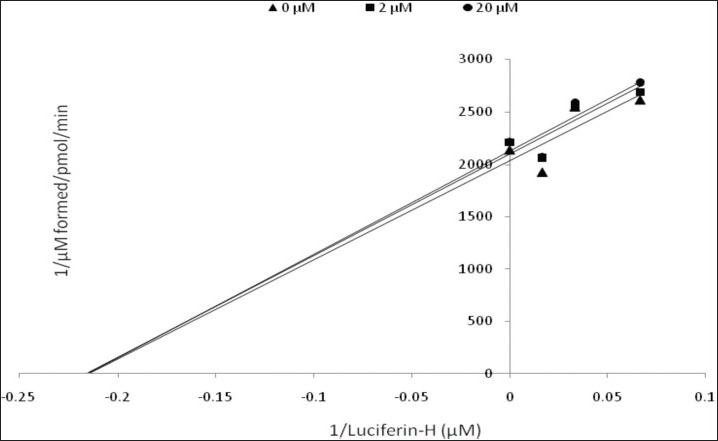
Figure 3.

Lineweaver-Burk plot of the inhibitory effect of mitragynine on CYP2C9 activity. Each data represents the value of three determinations (n=3)

Lineweaver-Burk plot of the inhibitory effect of mitragynine on CYP2C9 activity. Each data represents the value of three determinations (n=3)