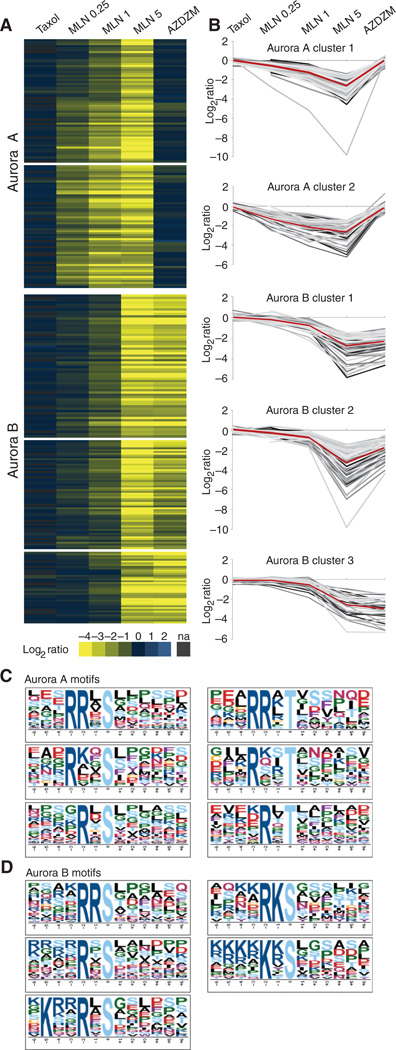
Fig. 2.
Cluster and motif analysis of putative Aurora A and B substrates. (A) Candidate Aurora A and B substrates identified by hierarchical clustering of ModSites with ratios reduced in either the MLN5 or the AZDZM conditions by 2.5-fold or more relative to uninhibited cells (na, not available). (B) Line graphs of log2 ratios of the ModSites of the corresponding Aurora A and B subclusters from panel A. The red line represents the average. (C) Motif analysis of both Aurora A–subclustered ModSites. (D). Motif analysis of all three Aurora B–subclustered ModSites.

