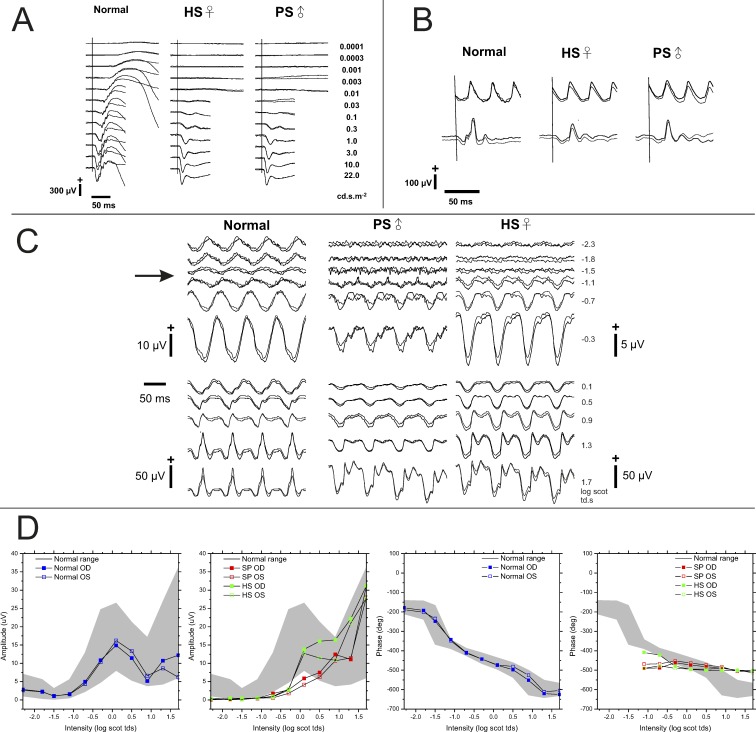
Figure 3.
Standard and 15-Hz flicker ERG obtained from a normal subject and 2 patients with GPR179 mutations. (A) Dark-adapted flash ERGs. Both patients lack the dark-adapted b-wave, but retain a normal a-wave. (B) Light-adapted ERGs to 3 cd s m−2; strobe flashes superimposed on a steady 30 cd s m−2 adapting field. The amplitudes of the 30-Hz flicker ERG (top trace) and the single-flash photopic ERGs fall within the normal range. The a-wave has a “square wave” appearance. (C) 15-Hz scotopic ERGs. Responses at low flash luminance levels present in control subjects are absent in patients. In patients, the responses first appear at −1.1 log scot td · s, near the initial amplitude minimum of control subjects, and then grow with increasing stimulus luminance. (D) 15-Hz ERG amplitude and phase data. The grey area indicates the mean ± 2 SD for 20 normal control subjects.21,22 Response amplitudes for patients remain below the normal range until high luminance stimuli are used. When measurable responses were recorded from patients they retained constant phase through an ∼3 log unit luminance range.

