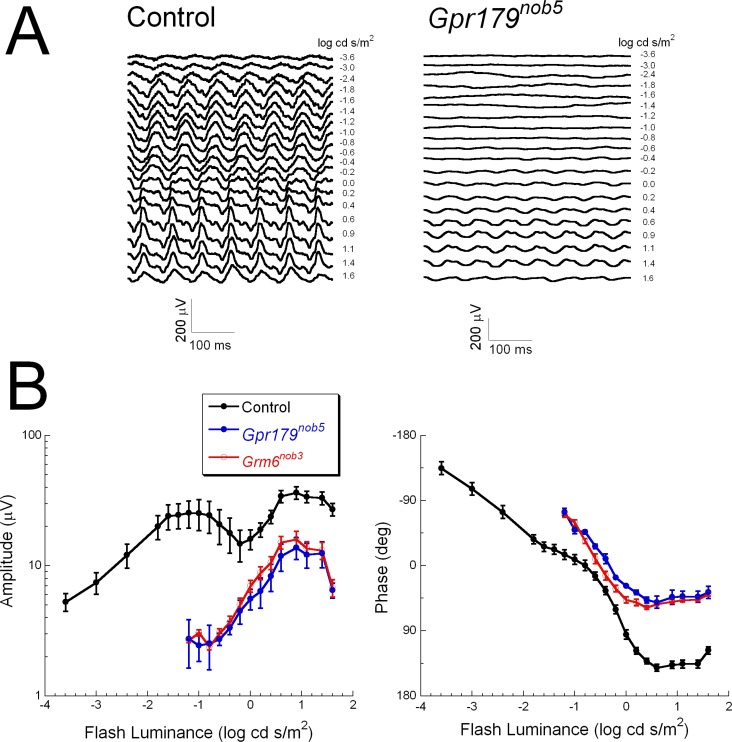
Figure 4.
Mouse 15-Hz flicker ERGs (A) Representative 15-Hz flicker ERGs obtained from a control mouse (left) and a Gpr179nob5 mouse (right). Stimulus luminance is indicated to the right of each waveform. (B) Average (±SEM) amplitude (left) and phase (right) plots obtained from 7 control (black), 4 Gpr179nob5 (blue), and 4 Grm6nob3 (red) mice.

