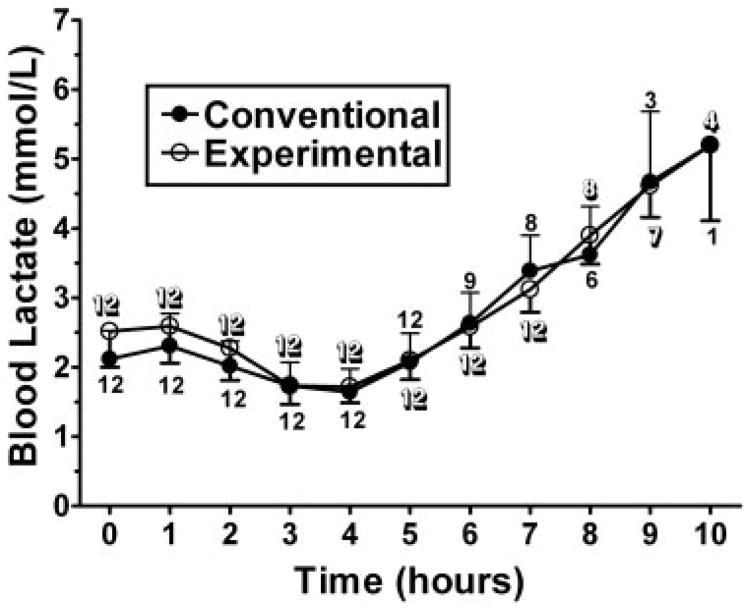
Figure 3.
Mean (±SD) lactate concentrations after administration of 100 g of the conventional (Argo; ACH Food Companies Inc, Memphis, TN) or experimental (Glycosade; Vitaflo International Ltd, Liverpool, United Kingdom) starch. The numbers located at the data points represents the n for that product at the given time point. No significant difference was found in lactate concentrations when comparing the 2 starches.

