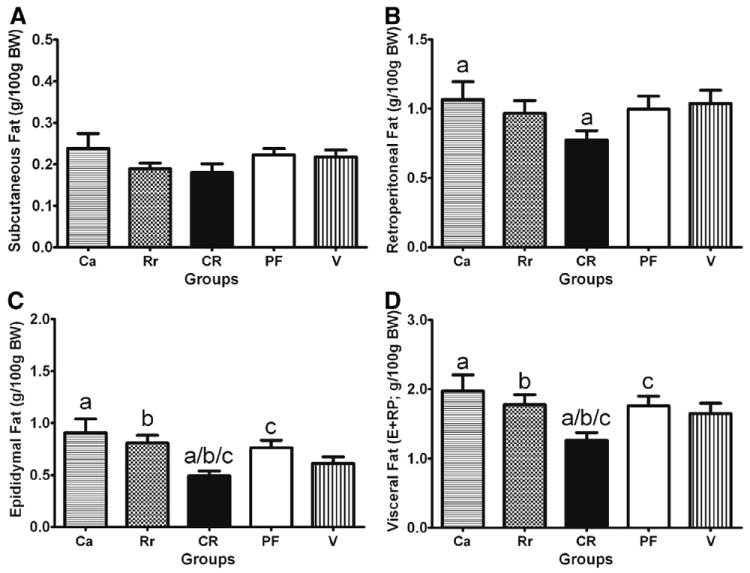
Fig. 4.

Mean white adipose tissue among groups after the 10-day treatment period. Adult male Sprague-Dawley rats exposed to high-fat diet for 13 weeks received a 10-day treatment of Ca (5.6 mg/kg; n = 10), Rr (20 mg/kg; n = 9), CR (5.6 mg/kg + 20 mg/kg; n = 10), or V (2% ethanol; n = 9) or were PF (n = 9) to the CR group. (A) Subcutaneous fat pad weights (g/100 g body weight). (B) Retroperitoneal fat pad weights (g/100 g body weight). (C) Epididymal fat pad weights (g/100 g body weight). (D) Visceral fat pad weight, which is epididymal (E) + retroperitoneal (RP) fat pad weights (g/100 g body weight). Comparisons were made using a 1-way ANOVA with post hoc LSD tests. Similar letters indicate a significant difference (P < .05) between groups.
