
Figure 2.
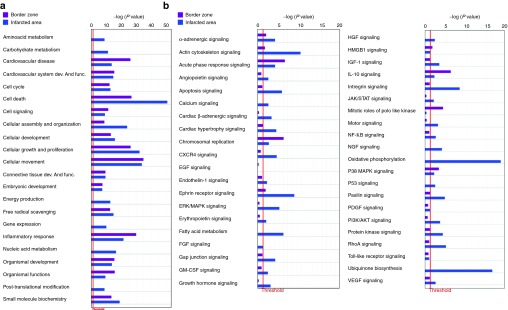
Comparison of biological functions and pathways between the border zone and the infarcted area. Ingenuity pathway analysis showing (a) selected biological functions and (b) Pathways in the border zone and in the infarcted area compared with the sham group. Bars, P values evaluated by exact Fisher test expressed in logarithmic scale. Threshold (evidenced by the red line) indicates the minimally accepted significance level of P < 0.05.