
Fig. 2.
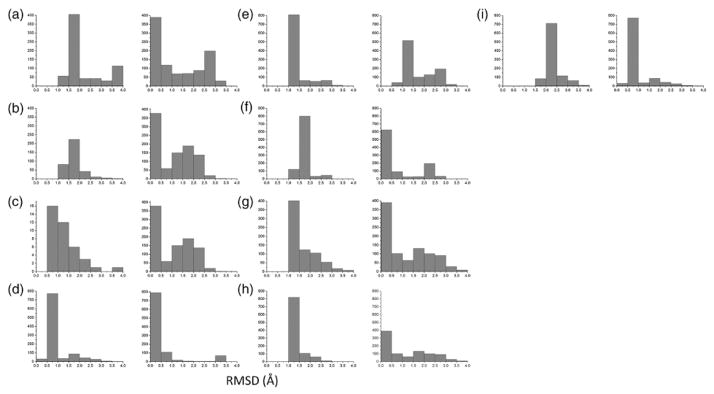
RMSD distributions for models generated using native inter-subunit Cβ distances. Each panel consists of two distributions. The distribution on the left was generated using an ideal helix. The distribution on the right was generated using the native helix. The RMSD value is between each model in the generated ensemble and the native structure. The distributions are: (a) GpA, (b) EphA1, (c) BNIP3, (d) phospholamban, (e) M2(xtal), (f) M2(NMR), (g) M2(ssNMR1), (h) M2(ssNMR2), and (i) BM2.