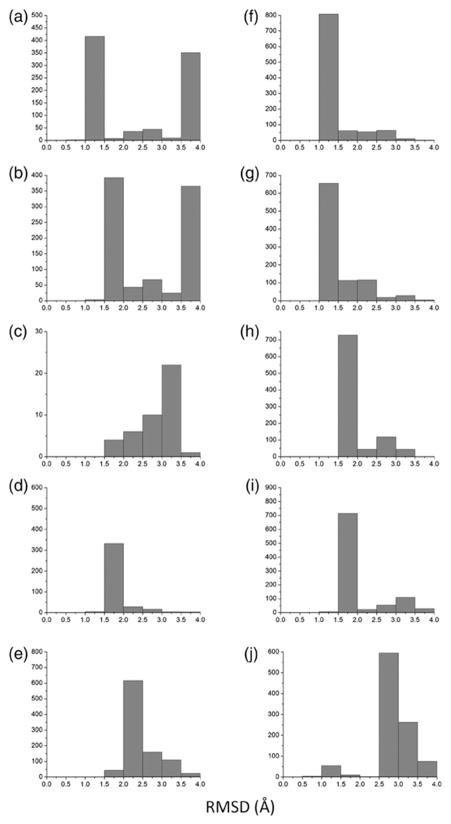
Fig. 4.
RMSD distributions for models generated using low-resolution experimental data. Each panel consists of a single distribution that was generated using an ideal helix. The RMSD value is obtained between each model in the ensemble and the native structure. The distributions are as follows: (a) GpA, (b) GpA(Cross-linking), (c) BNIP3, (d) EphA1, (e) BM2, (f) M2(xtal), (g) M2(NMR), (h) M2(ssNMR1), (i) M2 (ssNMR2), and (j) phospholamban.

