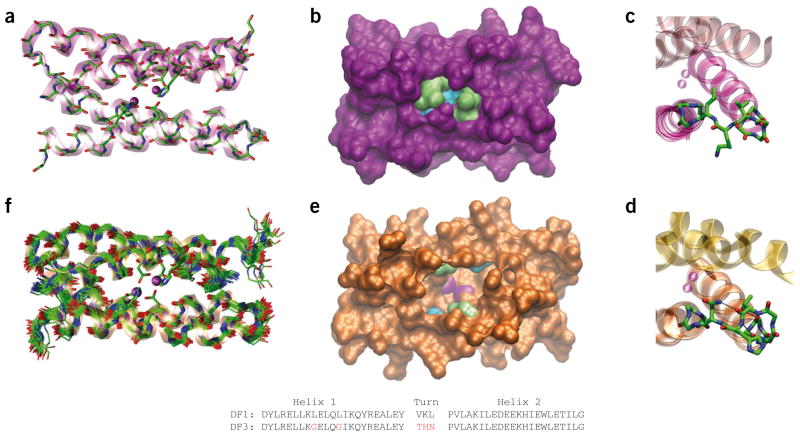
Figure 1.
Comparison of DF1 and DF3 structures. (a) Di-Zn(II)-DF1 crystal structure. (b) Di-Zn(II)-DF1 surface representation, displaying the accessibility to the active site and highlighting the different residues in position 9 (lime) and 13 (cyan). (c) Di-Zn(II)-DF1 loop structure. (d) Di-Zn(II)-DF3 loop structure; N-capping and C-capping interactions are depicted. (e) Di-Zn(II)-DF3 surface representation, displaying the accessibility to the active site and highlighting the different residues in position 9 (lime) and 13 (cyan). The point mutations introduced in proximity of DF3 active site create a cavity large enough to allow substrates to approach the metal ions (depicted in magenta in e). In contrast, the active site is completely buried in DF1 (b). (f) NMR bundle of the best 30 minimized structures for di-Zn(II)-DF3. The structures were generated with Visual Molecular Dynamics (VMD; http://www.ks.uiuc.edu/Research/vmd/). DF1 and DF3 sequence comparison are also reported. Amino acid substitutions in the DF3 sequence are indicated in red. The atomic coordinates of di-Zn(II)-DF3 ensembles, chemical shifts and NMR constraints have been deposited in the Protein Data Bank under accession code 2KIK.

