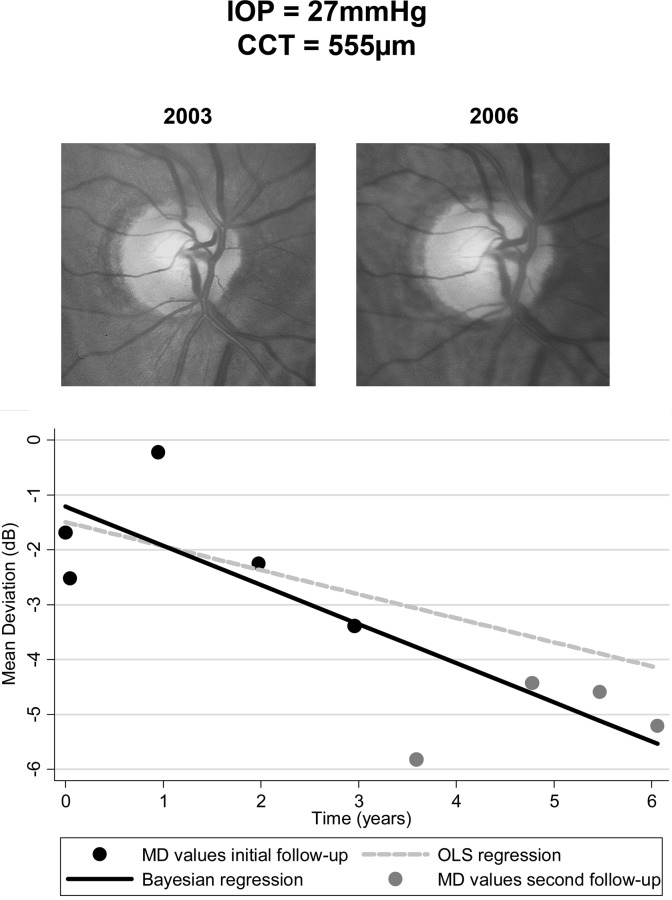
Figure 7.
Example illustrating differences in calculated slopes of change with the Bayesian versus OLS regression methods. The eye had mean intraocular pressure of 27 mm Hg and evidence of progressive optic disc damage during the first follow-up period (5 initial visual fields). Central corneal thickness was 555 μm. Slopes of change were calculated with the Bayesian (black line) and OLS (gray dashed line) methods by using data from the first follow-up period and extrapolated to the second follow-up period. Predictions from the Bayesian model were closer to the observed MD values (gray dots) during the second follow-up period than those obtained from OLS regression.

