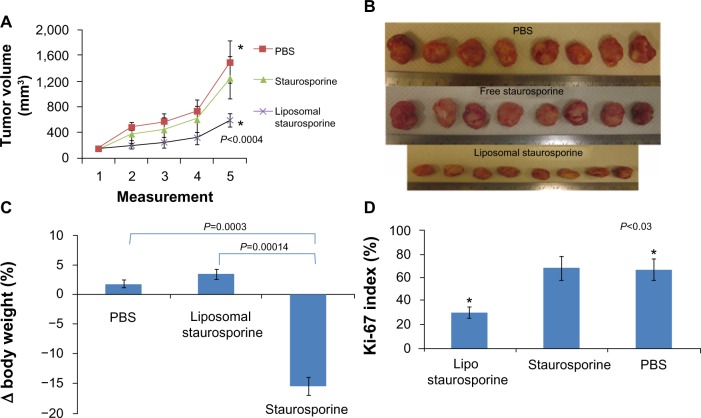
Figure 5.
Liposomal staurosporine markedly suppressed 180–200 mm3 U87 flank tumors with no body weight-related evidence of toxicity. There were four subjects per group for tumor size, tumor images, body weight, and Ki-67. (A) Control (■), liposomal staurosporine (×) and free staurosporine (▲). The x-axis represents measurements (mean ± standard deviation) on successive days after tumor implantation (Parametric P<0.0004, shown in figure; nonparametric P=0.00018). (B) Tumor images for liposomal staurosporine, free staurosporine, and PBS groups. (C) Body weight bar graph showing a significant decline in body weight with free staurosporine, indicating toxicity (parametric P=0.0003, shown in figure; nonparametric P=0.005). Note for the liposomal staurosporine group that, at the end of the treatment period, body weight as compared with pretreatment weight did not differ from the same measure in controls. (D) Proliferating tumor cells identified using Ki-67 in PBS, staurosporine, and liposomal staurosporine treatment groups. The PBS and liposomal staurosporine groups differed significantly (Parametric, shown in the figure, and nonparametric P<0.03) while PBS versus free staurosporine did not. * indicates comparison between PBC and liposomal staurosporine.
Abbreviations: PBS, phosphate-buffered saline; lipo, liposomal.

