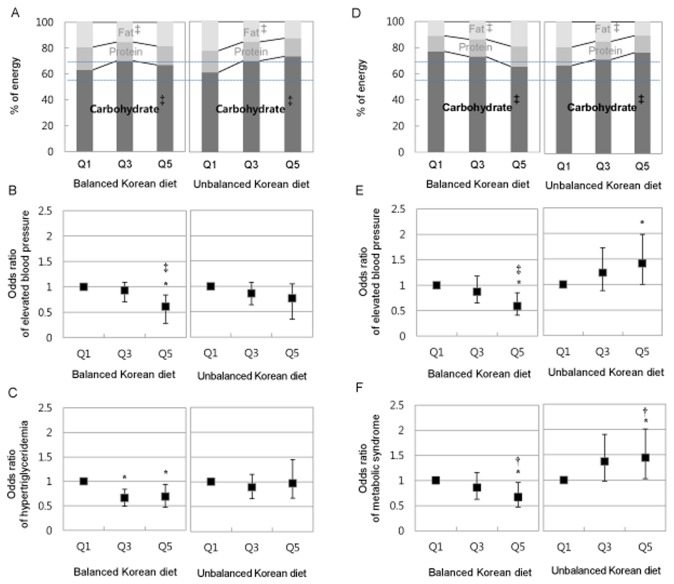
Figure 1. Metabolic syndrome risk and macronutrient composition of balanced Korean diet and unbalanced Korean diet.
A and D: Macronutrient composition by quintiles (Q1: lowest, Q3: middle, Q5: highest; Q3 and Q5 was calculated on the base of Q1); % of energy is the percentage of energy obtained from carbohydrate, protein and fat; A dotted line is recommended intake of carbohydrate for Korean; ‡, p for trend <0.001. B and E: Multivariate OR and 95% CI (bar) of elevated blood pressure; *, Significant odd ratio, ‡, p for trend <0.001; Adjusted for age, smoking, alcohol and physical activity. C and F. Multivariate OR and 95% CI (bar) of hypertriglyceridemia for men and metabolic syndrome for women; *, Significant odd ratio, †, p for trend < 0.05; Adjusted for age, smoking, alcohol and physical activity.

