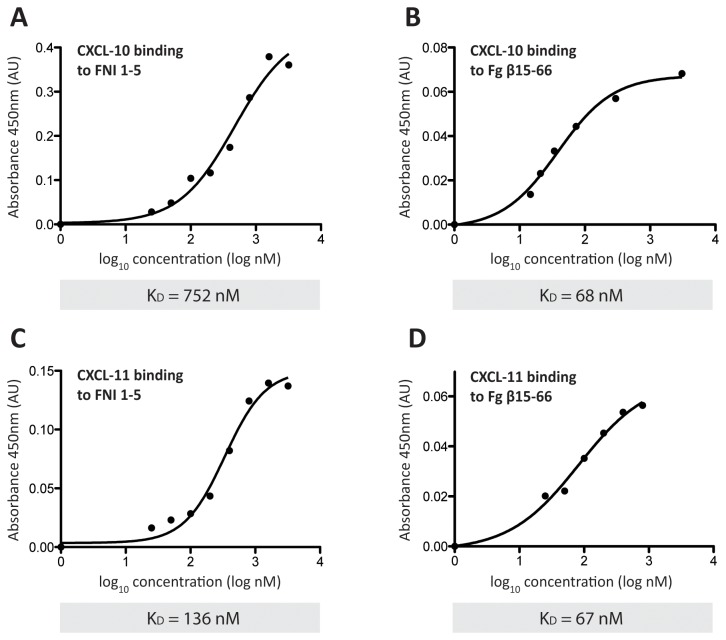
Figure 3. KD analysis.
KD was determined by indirect ELISA. ELISA plates were coated with CXCL10 (A, B) or CXCL11 (C, D) and probed with increasing concentrations (25 nM-3.2 μM) of either FNI 1-5 (A, C) or Fg β15-66 (B, D) in the absence of heparin. Binding to BSA was considered as background and subtracted (n=3, mean).

