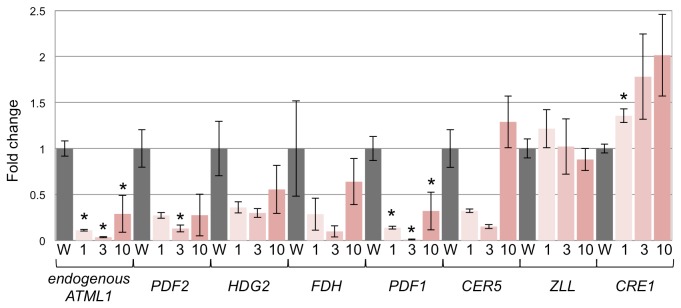
Figure 4. Quantitative RT-PCR analyses in ATML1-SRDX lines.

Real-time RT-PCR analysis of the expression of endogenous ATML1, PDF2, HDG2, FDH, PDF1, CER5, ZLL, and CRE1 in seven-day-old seedlings of estradiol-inducible lines 1, 3, and 10 (1, 3, and 10, respectively) and the wild type (W) grown in the presence of 10 μM estradiol. Expression levels were normalized to PP2A expression [20], and expression in the wild type was set to 1. Values are the mean ± SEM from three biological replicates. Asterisks indicate a statistically significant difference relative to the wild type (unpaired two-tailed t-test; p < 0.05). CRE1 mRNA expression was significantly increased in ATML1-SRDX line 1.
