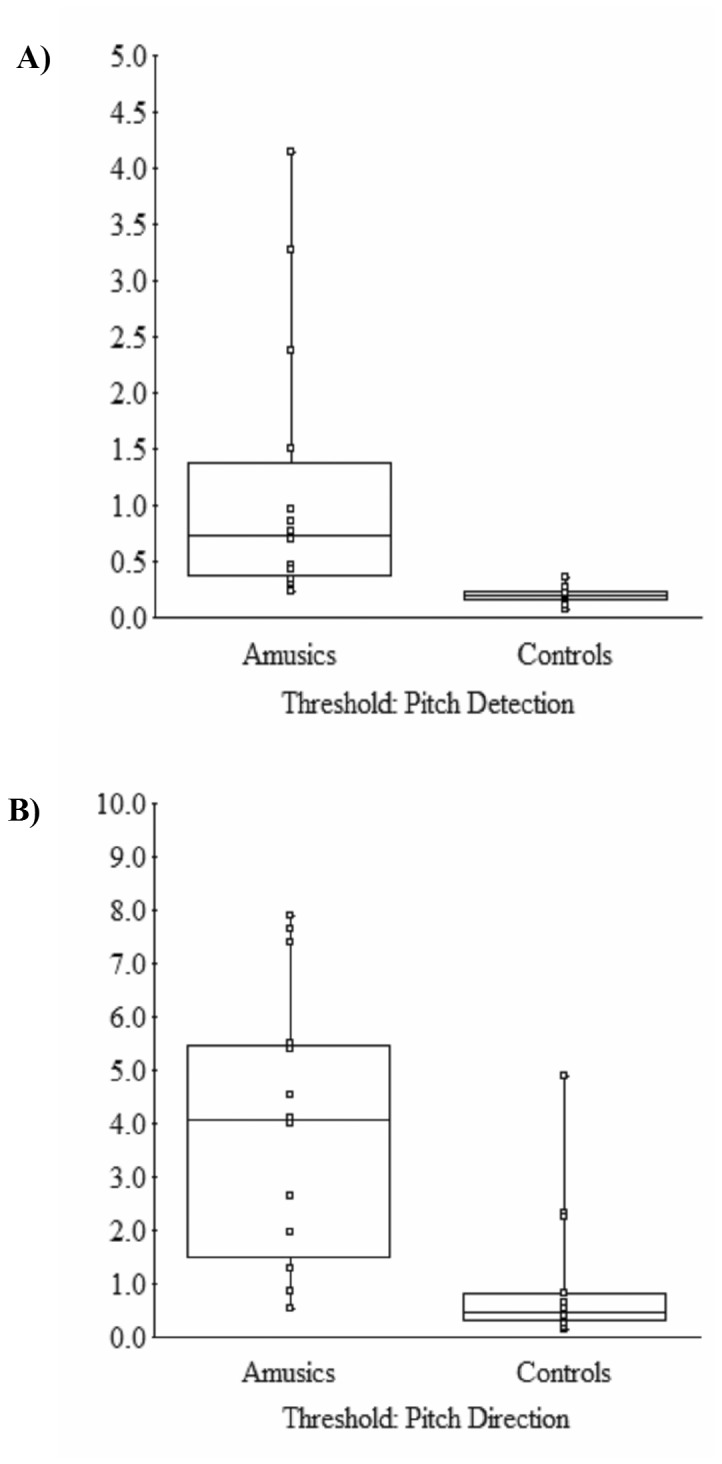
Figure 3. Box and Whiskers plot showing individual’s discrimination thresholds for the amusic and control groups.

A) Pitch change detection. B) Pitch direction discrimination. The box indicates the 25, 50, and 75% cut offs, with the whiskers spanning to the maximum and minimum values.
