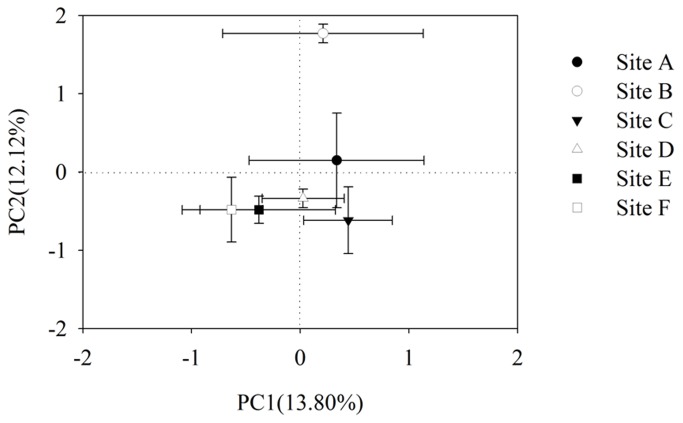
Figure 3. Principle component analyses (PCA) of bacterial functional diversity.
Sediments were collected from each six sampling sites (site A, site B, site C, site D, site E, site F) in the Zhou cun drinking water reservoir, eastern China. Data were calculated based on sole carbon substrate utilization pattern using BIOLOG ECO micro plates after incubation of 144 h. Numbers in brackets represent the percentage of variation explained by each factor, PC1 explains 13.80% of the variance of the data and PC2 explains 12.12% of the variance in the data, respectively. Bars represent plus one standard error (S.E) (n=3).

