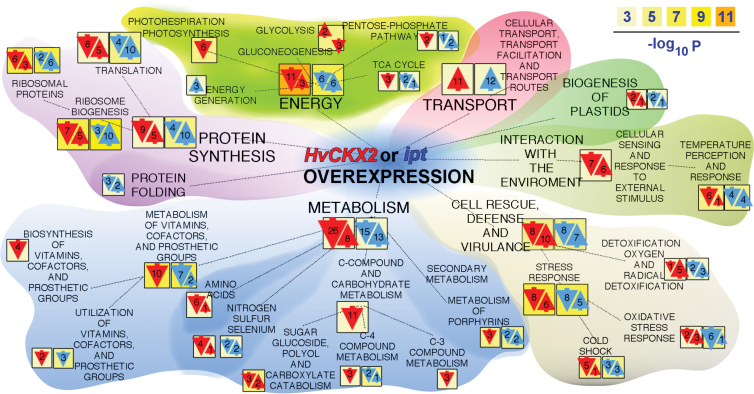
Fig. 3.
Proteins that responded to HvCKX2 and ipt activation: functional classification according to the Munich Information Center for Protein Sequences (MIPS). The orientation and size of arrows indicate the direction of protein regulation (up or down) and number of proteins in a particular category, respectively. Red and blue: categories induced by HvCKX2 and ipt activation; the colour scale indicates the statistical significance of each category. The BioMap tool package (http://virtualplant.bio.nyu.edu/) was used for the analysis.

