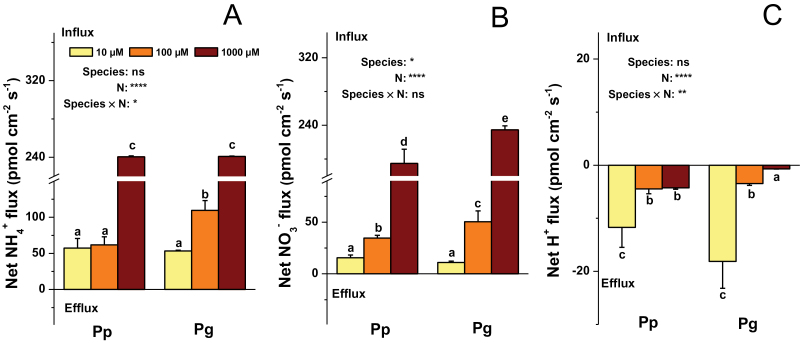
Fig. 2.
Net fluxes of NH4 + (A), NO3 – (B), and H+ (C) in 10min at 15mm from the root apex of fine roots of P. popularis (Pp) and P. alba × P. glandulosa (Pg). Data indicate mean ± SE (n = 6). The measuring solution (pH 5.5) contained 0.1mM KCl and 0.1mM CaCl2 as well as 10, 100, or 1000 μM NH4NO3. Bars labelled with different letters indicate significant difference between the treatments. P-values of the ANOVAs of species, N treatment, and their interaction are indicated. *P < 0.05; **P < 0.01; ***P < 0.001; ****P < 0.0001; ns, not significant (this figure is available in colour at JXB online).

