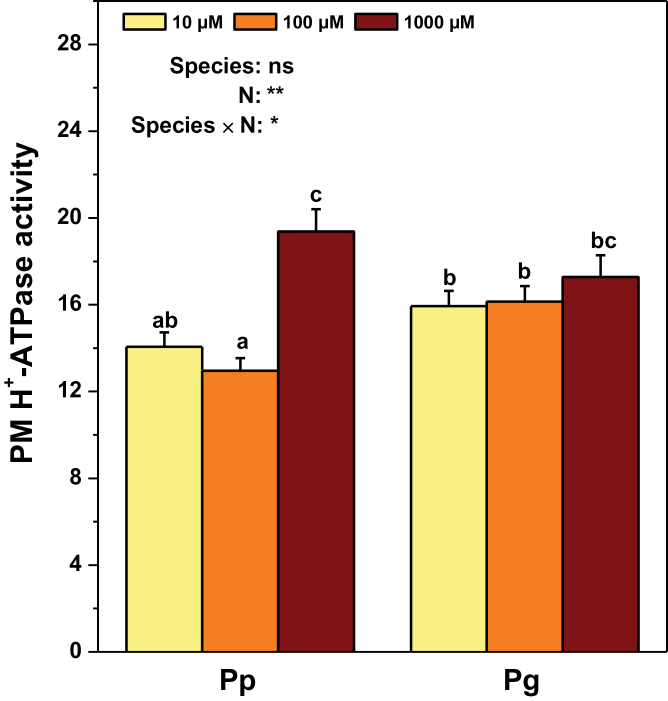
Fig. 3.
PM H+-ATPase activity (mmol Pi h–1 (mg protein)–1) in roots of P. popularis (Pp) and P. alba × P. glandulosa (Pg) exposed to 10, 100, or 1000 μM NH4NO3. Bars indicate mean ± SE (n = 6). Different letters on the bars indicate significant difference. P-values of the ANOVAs of species, N treatment, and their interaction are indicated. *P < 0.05; **P < 0.01; ***P < 0.001; ****P < 0.0001; ns, not significant (this figure is available in colour at JXB online).

