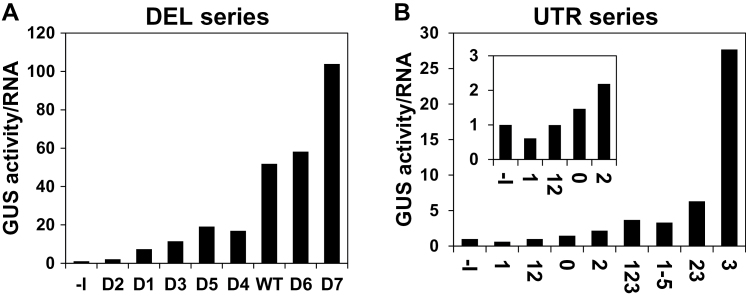
Fig. 4.
Translational efficiency of the DEL (A) and UTR (B) series of constructs. Each column presents the ratio of average GUS activity to average GUS mRNA in the six samples described in Fig. 6A and B. The translational efficiency of the –I construct of each series had the value of 1. The inset graph shows the ratios on a smaller scale.

