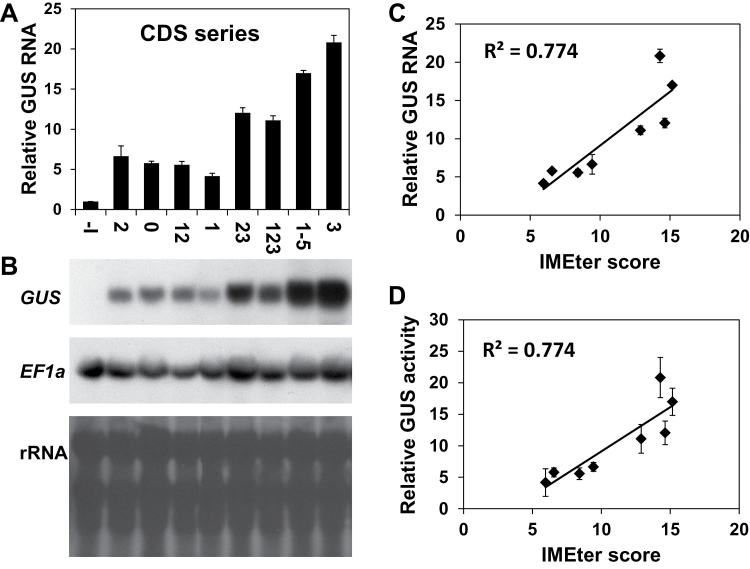
Fig. 6.
The levels of GUS mRNA in plants expressing the CDS series constructs. (A) Relative levels of GUS mRNA in plants expressing the CDS series constructs. Each column shows the mean and standard error of GUS transcript levels in six of the 10 samples whose GUS activity was presented in Fig. 5C. Each of the six samples included ~70 two-week-old plants. GUS mRNA content of the –I construct of this series was assigned the value of 1. (B) One of the six replicates of the northern blot analysis. The membrane was first stained with methylene blue to visualize the rRNA in order to confirm equal loading, then probed with the GUS coding sequence, and then stripped and probed with the housekeeping EF1α gene as another control. (C) The correlation between GUS mRNA levels and the IMEter v2.0 scores of the introns. (D) The correlation between GUS activity and the IMEter v2.0 scores of the introns.

