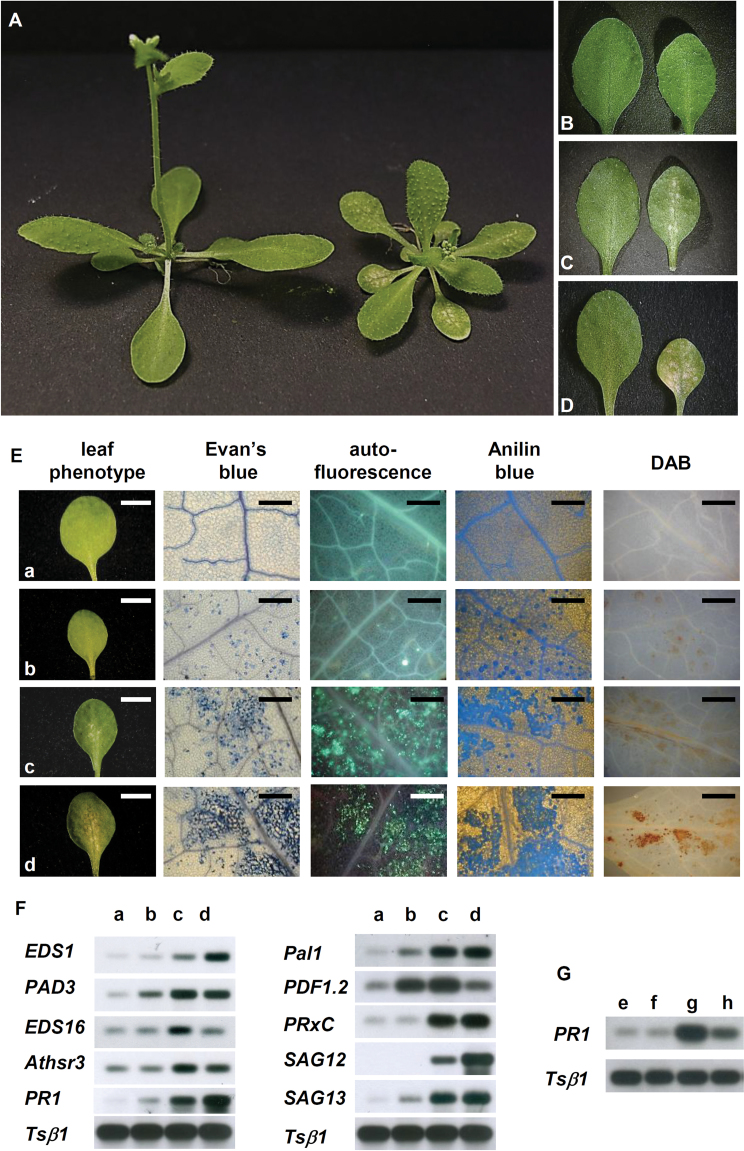
Fig. 1.
Phenotype of the mutant and analyses of the biochemical and molecular markers associated with defence responses. (A) Three-week-old wild-type (left) and mutant (right) plants. (B–D) Three-week-old wild-type (left) and mutant (right) leaves: while all the wild-type leaves are green, in the mutant the third pair of leaves are green (b, right), the second show small chlorotic spots (c, right), and the first show large chlorotic spots (d, right). (E) Histochemical analysis of 3-week-old wild-type and mutant leaves: in the first column is shown the phenotype of leaves analysed (a, wild-type green leaf; b, mutant green leaf; c, mutant leaf with small chlorotic spots; d, mutant leaf with large chlorotic spots), in the second column staining with Evan’s blue, in the third natural autofluorescence, in the fourth aniline blue staining, and in the fifth DAB staining. Bars indicate 5mm in the first column, 500 µm in the second, third, and fourth columns, and 1mm in the fifth column. (F) RT–PCR analysis of genes associated with plant defence responses in 3-week-old leaves of a wild-type and mutant plant (a, wild-type green leaf; b, mutant green leaf; c, mutant leaf with small chlorotic spots; d, mutant leaf with large chlorotic spots). (G) Analysis of SAR activation in the fzl-Ler mutant by comparison of the expression levels of the PR1 gene in wild-type rosette leaves (e), wild-type cauline leaves (f), mutant rosette leaves (g), and mutant cauline leaves (h).

