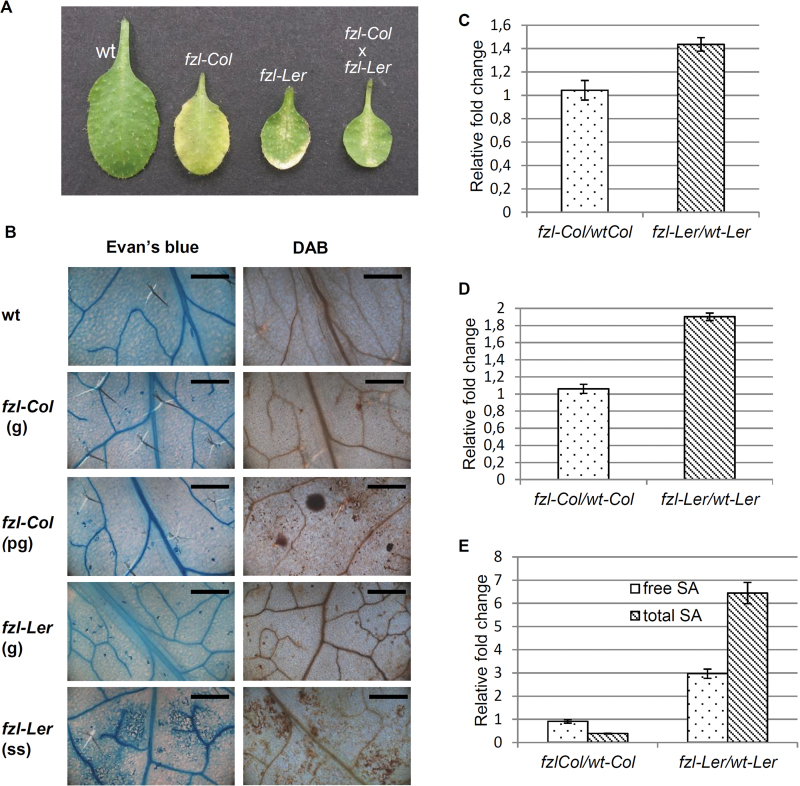
Fig. 6.
Comparison of the fzl mutant phenotype in the two ecotypes Columbia (fzl-Col) and Landsberg (fzl-Ler). (A) Phenotype of 3-week-old leaves, from left to right: wild type, fzl-Col, fzl-Ler, and F1 progeny obtained by crossing fzl-Col×fzl-Ler. (B) Evan’s blue and DAB staining on 3-week-old leaves of the wild type, fzl-Col, and fzl-Ler. g, green leaves; pg, pale green leaves; ss, leaves with small spots. Bars=500 µm. (C) Cell death quantification by electrolyte leakage measurement. Data reported refer to the time point 30min, but a similar trend was observed at the successive time points analysed (data not shown). Values are expressed as fold change relative to the wild type and are the mean of three replicates. Bars represent the standard error. (D) H2O2 content quantified as fold change relative to the wild type. Values are the mean of three replicates. Bars represent the standard error. (E) free and total SA measurement. Values are the mean of three replicates. Bars represent the standard error.

