Fig. 3.
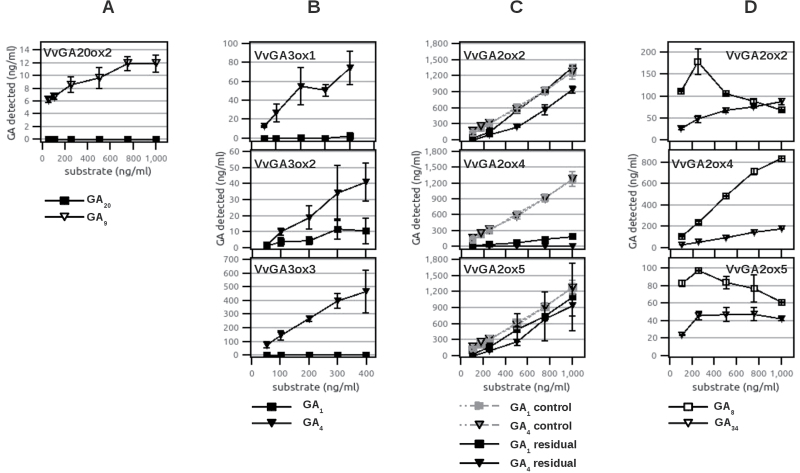
Substrate preference of grapevine GA oxidases in vitro. Substrate preferences of E. coli lysate expressing recombinant GA oxidases when supplied with increasing concentrations of substrate mixture; on the x-axis is reported the concentration of substrates supplied to the reaction, whereas on the y-axis is the concentration of residual substrates and/or products formed. Error bars show the SD. (A) Activity of recombinant VvGA20ox2 supplied with increasing concentrations of GA12 and GA53 produces GA9 (triangles) but not GA20 (filled squares); n=4. (B) Activity of GA3ox proteins: recombinant VvGA3ox1, VvGA3ox2, and VvGA3ox3 supplied with increasing concentrations of GA9 and GA20 produce GA4 (filled triangles) and GA1 (filled squares); n=3. (C and D) Activity of recombinant VvGA2ox1, VvGA2ox4, and VvGA2ox5 when supplied with increasing concentrations of GA1 and GA4. (C) Residual substrates detected in the reactions are represented by black squares (GA1) and black triangles (GA4) (n=2), and controls are represented by grey squares (GA1) and triangles (GA4) (n=5). Controls are the substrates measured in parallel experiments conducted with E. coli lysates expressing proteins with no GA oxidase activity (VIT_16s0098g00860) and take into account systematic errors and ion suppressions, allowing the substrate consumption due to protein activity to be determined effectively. (D) Deactivation products detected in the reactions are represented by open squares (GA8) and triangles (GA34) (n=2)

