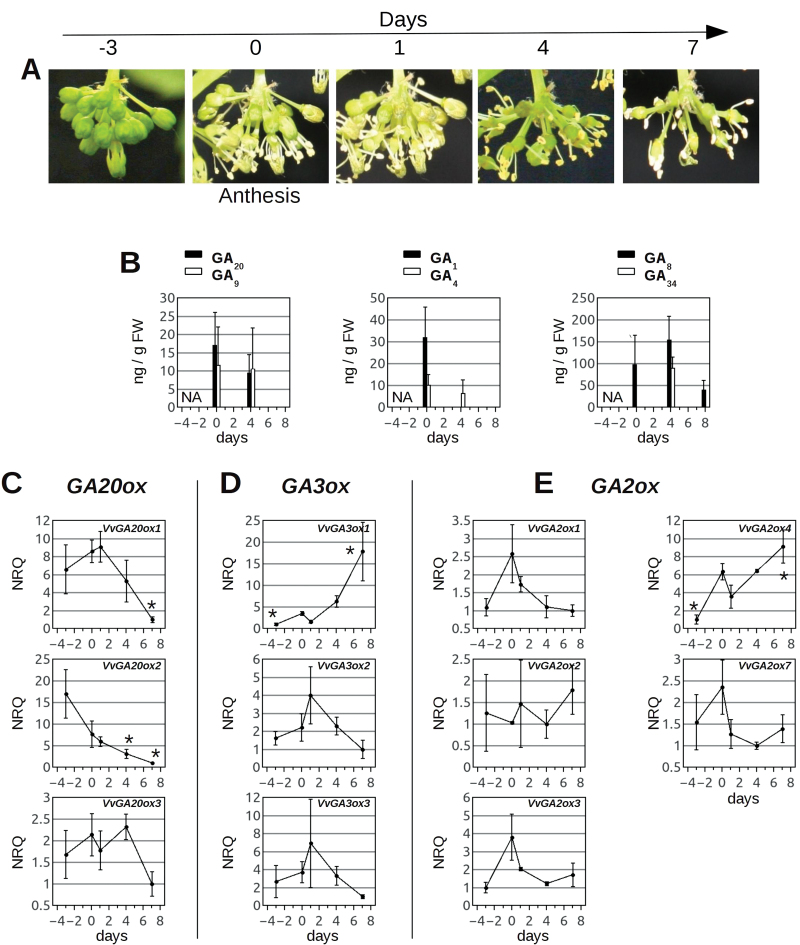
Fig. 6.
Accumulation of endogenous GAs and GA oxidase transcripts in inflorescences of Pinot Gris during fruit-set. (A) Section of an inflorescence of Pinot Gris in a time window of 3 d prior to anthesis until 7 d after anthesis. (B) Quantification of endogenous GAs in inflorescences of Pinot Gris at anthesis (0) and after 4 d and 8 d. At time point 0, ~50% of the flowers on the inflorescence were open, whereas ~50% retained their calyptra. After 8 d, some carpels were enlarging into small fruits. Vertical bars indicate the average quantity of GAs in ng g–1 of frozen weight; error bars indicate the SD. Data were used for the average only where GAs were detected in at least half of the biological replicates (6–8) analysed. 13-Hydroxylated GAs are represented by filled bars (GA1, GA20, GA8) and non-13-hydroxylated compounds are represented by open bars (GA4, GA9, GA34); NA, not analysed. (C–E) Averaged NRQs of grapevine GA20ox (C), GA3ox (D), and GA2ox (E) genes expressed in inflorescences of Pinot Gris, as measured by qRT–PCR, at anthesis (time point 0), 3 d prior to anthesis (–3), and after 1, 4, and 7 d. Relative quantities are normalized against the expression of ACTIN, GADPH, and EF1α. Asterisks indicate transcript accumulations that are significantly different (P < 0.05) from the corresponding value at anthesis. (This figure is available in colour at JXB online.)

