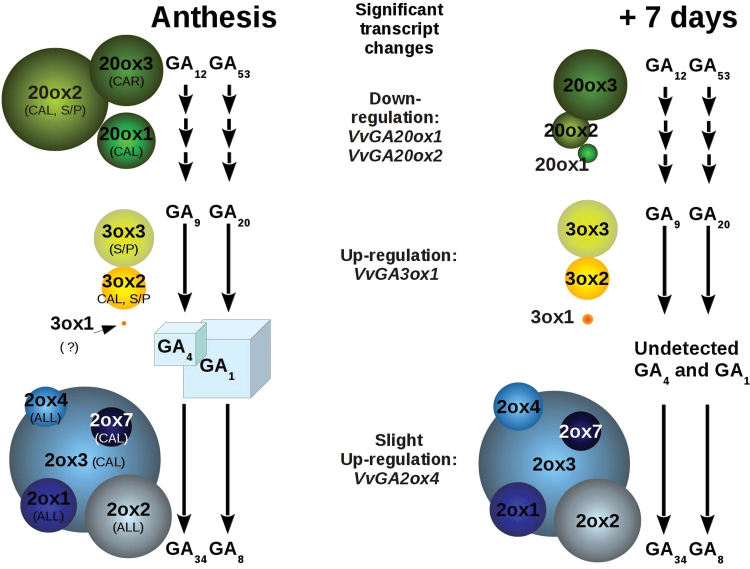
Fig. 8.
Schematic representation of GA metabolism in grapevine inflorescence. Schematic overview of GA1 and GA4 metabolism in inflorescences at anthesis (left) and after 7 d (right side). Squares represent detected GA1 and GA4, and their dimension is proportional to their concentrations. Circles represent genes whose transcripts were detected (full-length cDNA sequences) in inflorescences. Their dimension at anthesis is proportional to their transcript abundance, as determined by RNA-seq; whereas at 7 d it is proportional to their expression level as extrapolated by qRT–PCR data (only significant changes are reported, P < 0.05). For each gene, the flower organ in which it is predominant is indicated: CAL, calyptra; S/P, stamen and/or pollen; CAR, carpel; ALL, the transcript is distributed in all flower organs. (This figure is available in colour at JXB online.)

