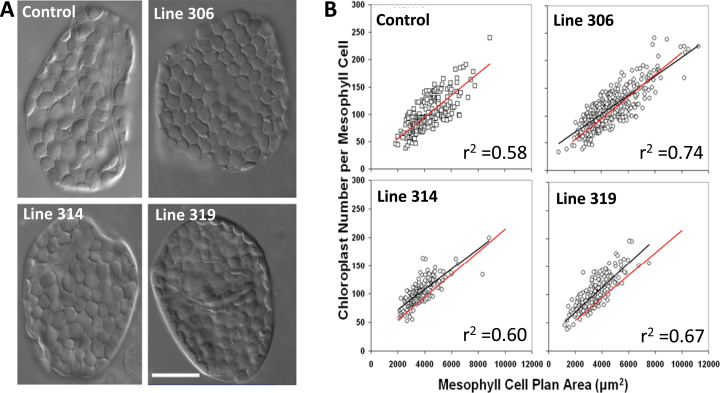
Fig. 5.
Isolated leaf mesophyll cells (A) and chloroplast number per mesophyll cell versus cell size (B) from the youngest fully expanded leaves of 40-d-old control or 35S::ATHB17 lines. (A) Mesophyll cells were viewed with Nomarski differential interference contrast optics. Bar, 25 μm. (B) Each data point represents the measurement from one cell. The solid red line in each figure represents the regression line for the empty-vector control line, while the solid black line is the regression of the transgenic in each panel. Values for r 2 are indicated on the graphs.

