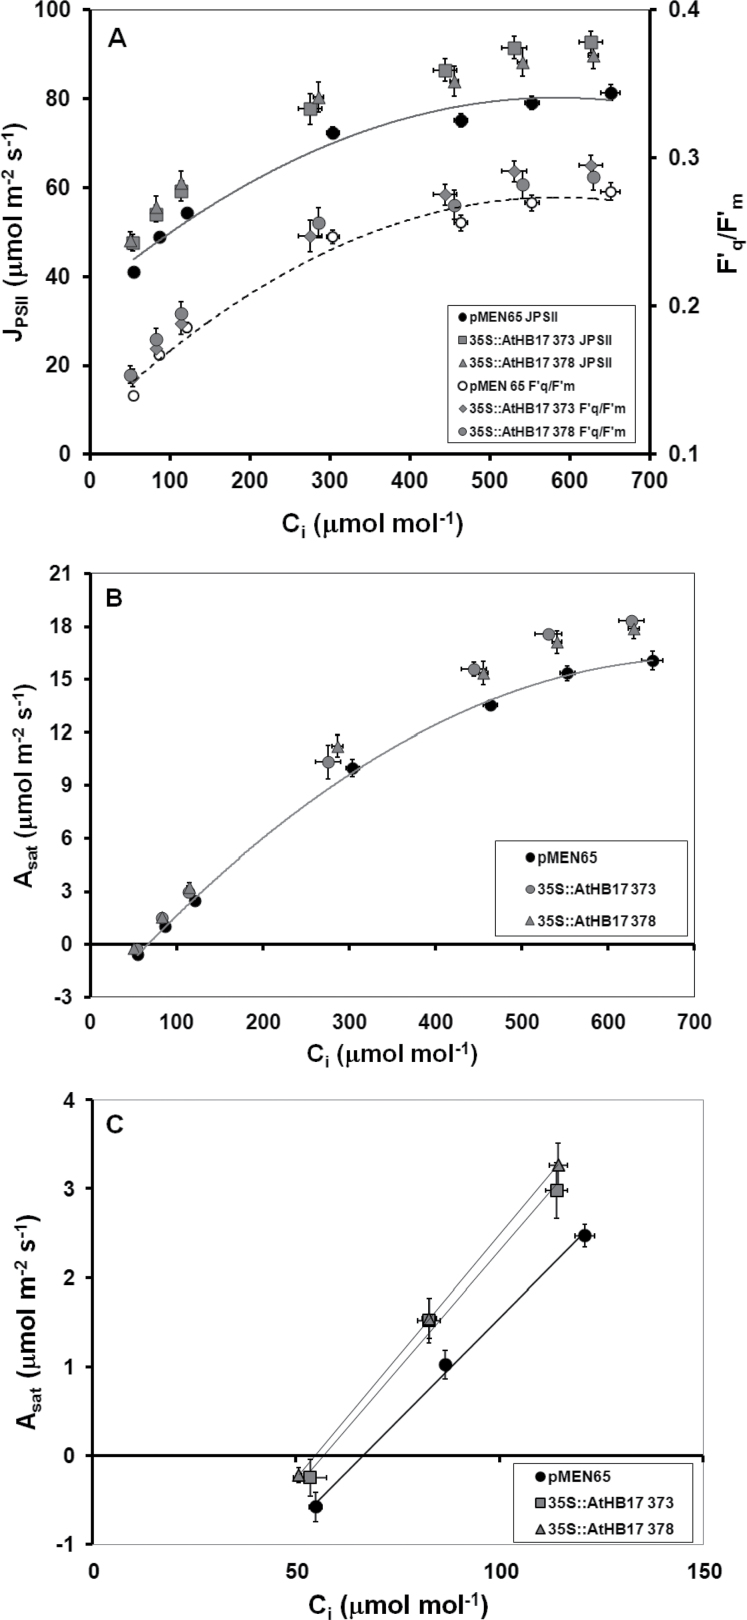
Fig. 6.
Plot of J PSII and F′v/F′m (A) and A sat (B, C) against C i for select 38-d-old 35S::ATHB17 lines and an empty-vector control line (pMEN65). The data shown in (C) give an expanded view of the CO2-limited part of the larger A sat/C i response curve shown in (B). The photosynthetic phenotypes reported have proved to be highly penetrant across multiple 35S::ATHB17 lines, and the effects described were repeatable in multiple independent experiments. Results are shown as the mean±SE (n=6) from a representative experiment.

