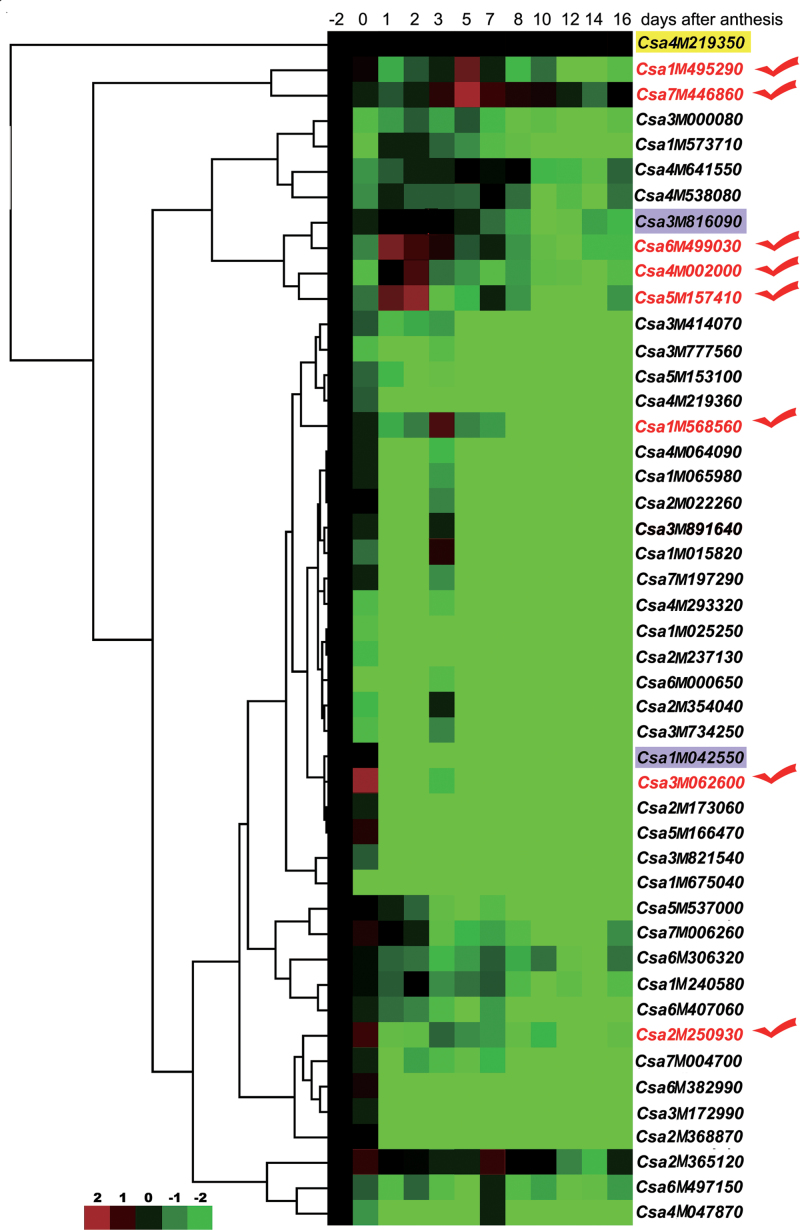
Fig. 3.
Expression profiles of kinesin family genes during early fruit development in cucumber by hierarchical clustering. Log2-transformed data were used for the cluster analysis (n=3). Expression data for a given gene are shown relative to the expression at –2 DAA. The inset shows the colour legend used in the cluster representation (log2 ratios). CsACTIN genes were used for normalization of quantitative RT-PCR results.

