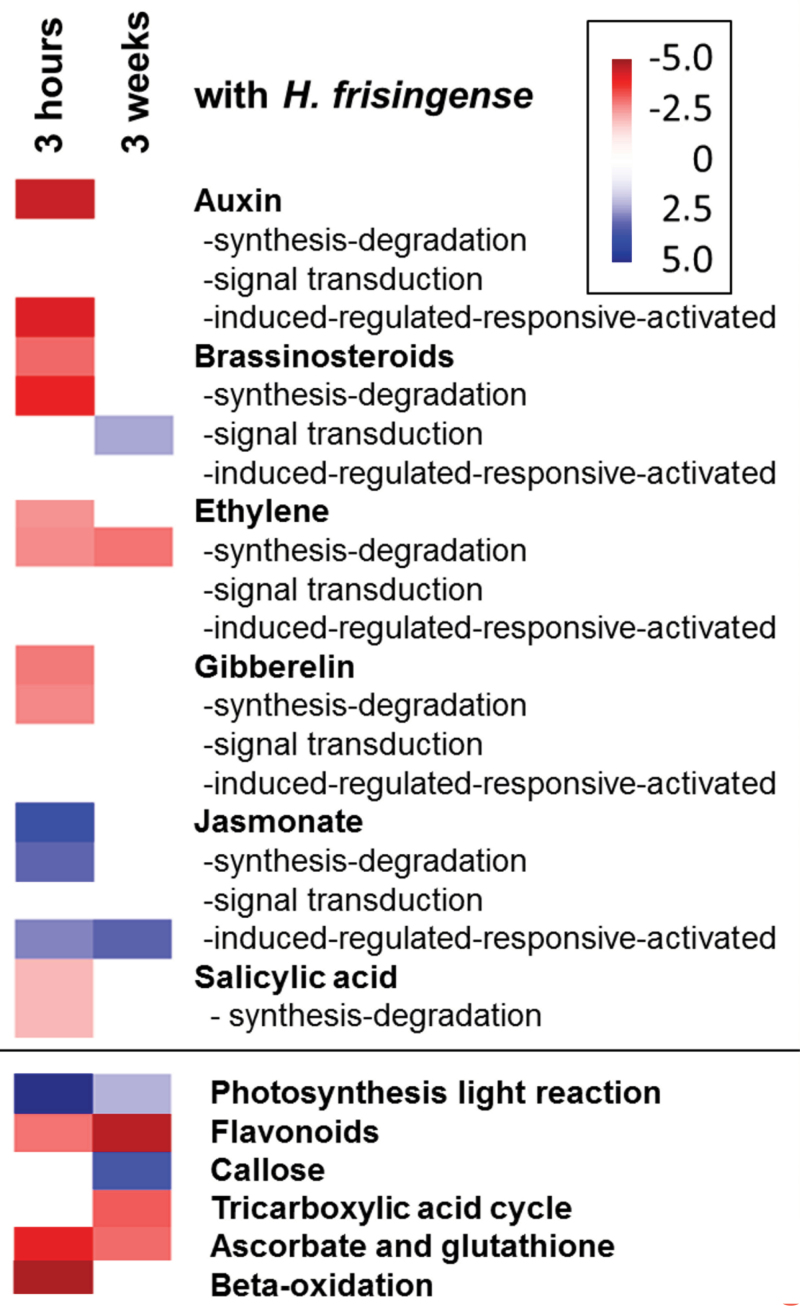
Fig. 5.
Differential expression of M. sinensis transcript categories related to hormones and key metabolic functions in response to H. frisingense inoculation. Red indicates lower expression of gene categories compared with non-inoculated plants, while blue indicates higher expression. Non-significant differences (z-score <1.96) are shown in white. Colouring is according to the z-scores of the bin-wise Wilcoxon test. A z-score of ±1.96 represents a P value of 0.05. The plot was generated using PageMan.

