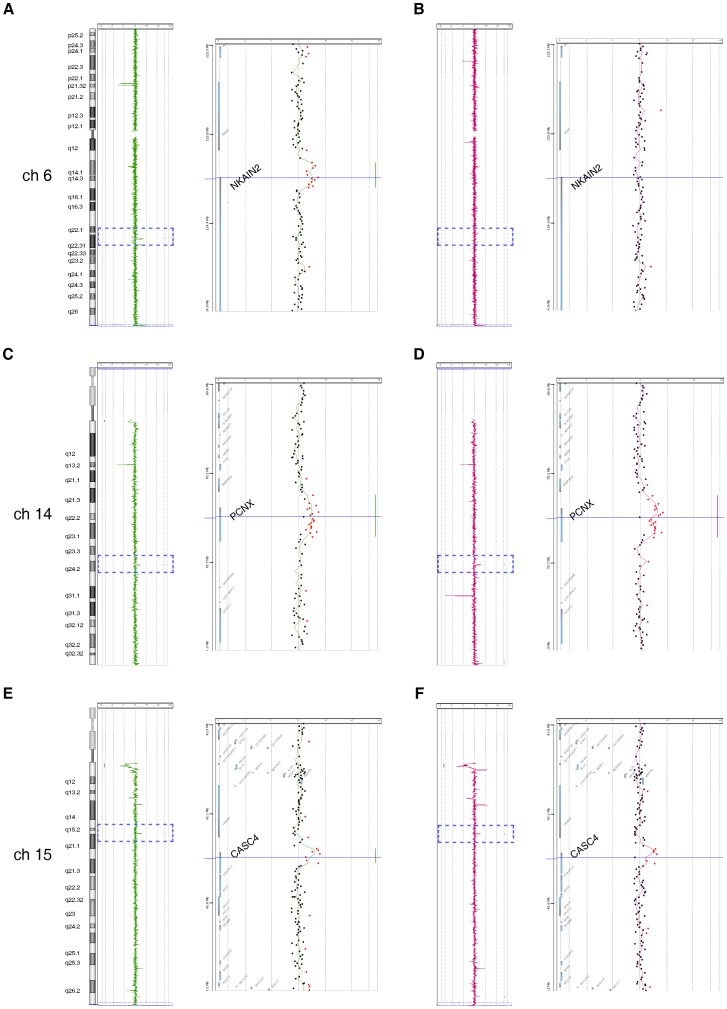
Figure 3. Copy number alterations of chromosomes 6, 14 and 15 in the affected siblings.
The chromosome 6, 14 and 15 views (left) display the copy number profile of analysing constitutional DNA of III-2 (A, C and E) and III-3 (B, D and F) patients versus normal references. The gene views (right) magnify the selected amplification regions at 6q22, 14q24 and 15q15 indicating the log2 copy number ratios of individual oligos.

