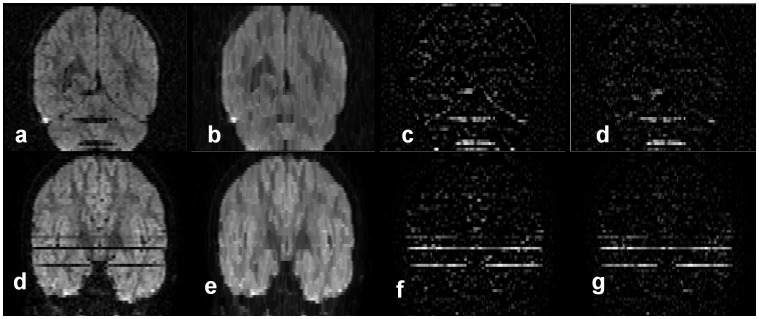
Figure 2. The process of the cISID calculation.
a, original DW image in a coronal view; b, after the “close” operation along the slice selection (z) direction; c, the difference map between (b) and (a); and d, the final cISID map, in which the ISID of the average of all DW images was subtracted to suppress ISID due to through-slice anatomical changes. cISID calculation on another example with signal drop of several slices. (e–h): another example of whole slice intensity drop highlighted by cISID.

