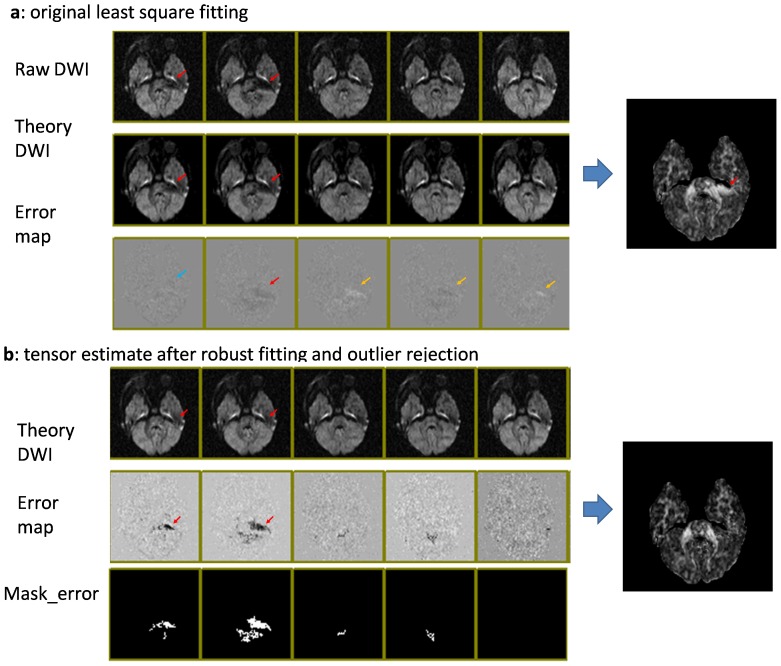
Figure 4. Comparison of tensor-fitting results, with and without outlier rejection.
Red arrows indicate the locations of corrupted pixels. a: Results with conventional least squares fitting. The corrupted pixels cause faulty tensor fitting (theory images) and subsequent errors in FA values. Due to the fitting error, the error maps (fitting residuals) may not correctly highlight the corrupted pixels; not only corrupted pixels (blue arrows), but also some non-corrupted pixels (yellow arrows), reveal errors. b: Results with outlier rejection. If the pixel-rejection algorithm correctly rejects the corrupted pixels, the theory images are unaffected by the artifacts and the error maps accurately highlight the corrupted pixels. The images are screen shots from DtiStudio with which the post-processing rejection algorithms were implemented and tested.

