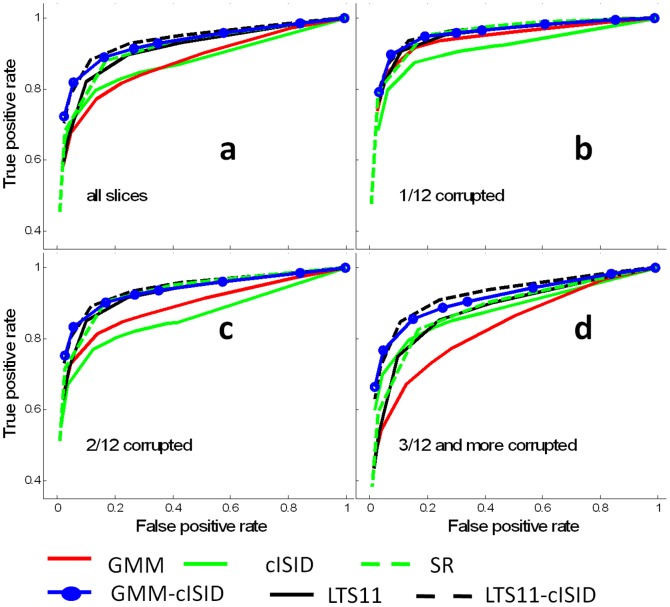
Figure 5. ROC curves of the pixel-by-pixel corruption detection methods.
Six methods were compared, as indicated in the figure. Each ROC curve in the figures was calculated from the data of all the slices in the group. a: The results of all data combined; b–d: the ROCs with 1, 2, and ≥3 corrupted DWIs in the 12 diffusion orientations (1/12, 2/12 and ≥3/12).

