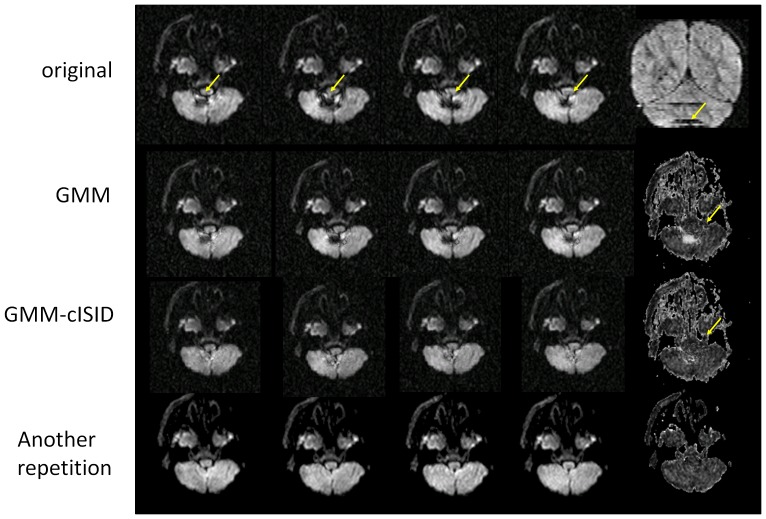
Figure 6. Demonstration of different rejection algorithms in a severely affected case.
Top row: The four affected images in the axial views and one coronal view on the right (artifacts are demarcated by yellow arrows); 2nd row: theory images (left four columns) and FA maps (right column) computed after outlier rejection using the GMM. 3th row: GMM-cISID method with an FA map in the right column. 4th row: another repetition.

