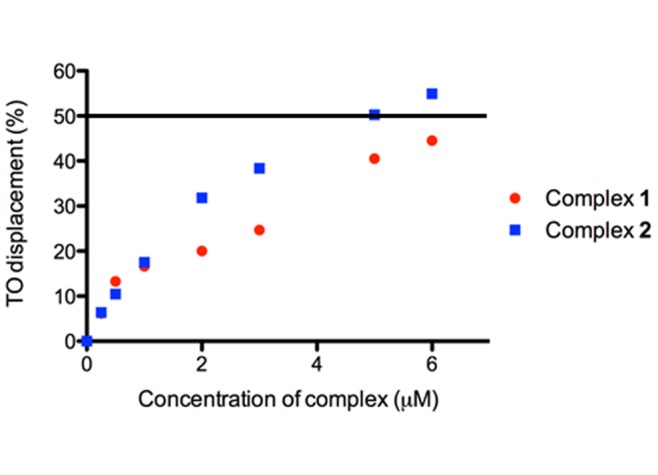
Figure 5. G4-FID titration curves of the ATP G-quadruplex in the presence of increasing concentration of complex 1 and 2 in Tris-HCl buffer (50 mM Tris, pH 7.0, 100 mM KCl).

DC50 value is determined by half-maximal concentration of compound required to displace 50% TO from DNA.
